🚀 [2026 Kickoff] Smarter AI reporting, flexible funnels, usage auditing & more
Usermaven started off the year with a powerful set of upgrades.
This release brings smarter AI-powered summaries, more flexible funnel analysis, clearer usage visibility, and stronger controls across the platform.
Each improvement is built to remove friction and bring insights to the surface faster.
And we’re just getting started.
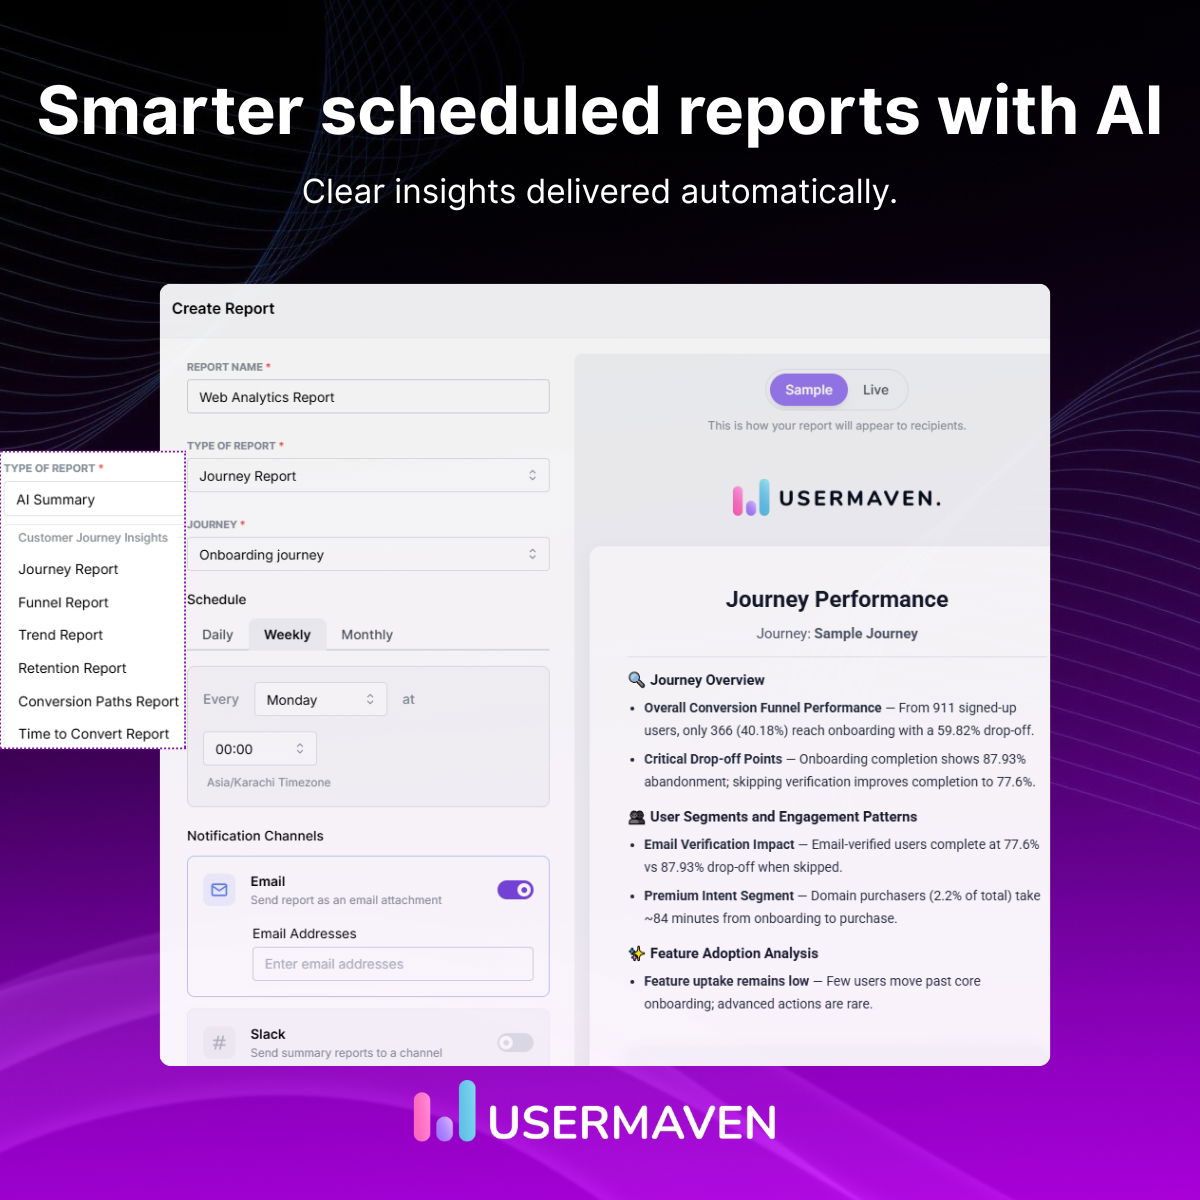
AI-powered summaries expanded across scheduled reports
AI-powered summaries are now available across more scheduled report types, helping you quickly understand what changed without digging through every metric.
- Set up AI summaries through scheduled reports directly from analytics modules, including Journeys, Funnels, Trends, Retention, and Attribution.
- Get clear, written explanations highlighting key changes and performance patterns.
- Share summaries automatically via email or Slack on your chosen schedule.
This makes recurring reports easier to read, easier to share, and faster to act on.
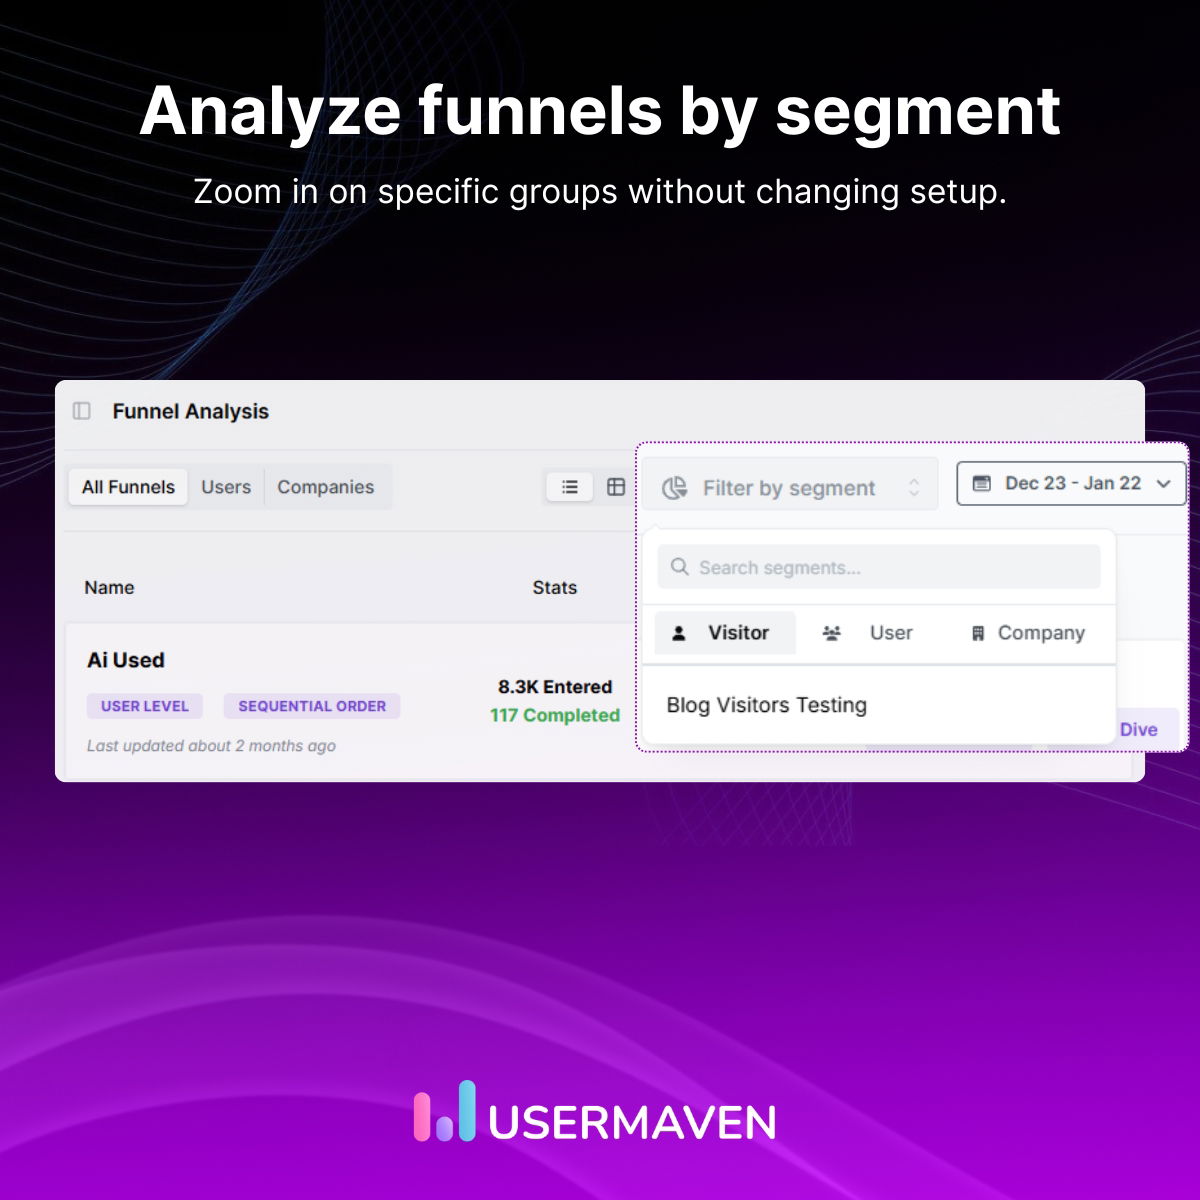
Segment filters added to Funnels
Funnels are now more flexible with built-in support for Segment-based filtering.
- Apply Segment filters directly inside funnel analysis.
- Analyze conversion behavior for specific Visitor, User, or Company segments.
- Narrow funnel insights to focused audience groups without changing the funnel setup.
This helps you understand how different audiences move through your funnels with greater precision.
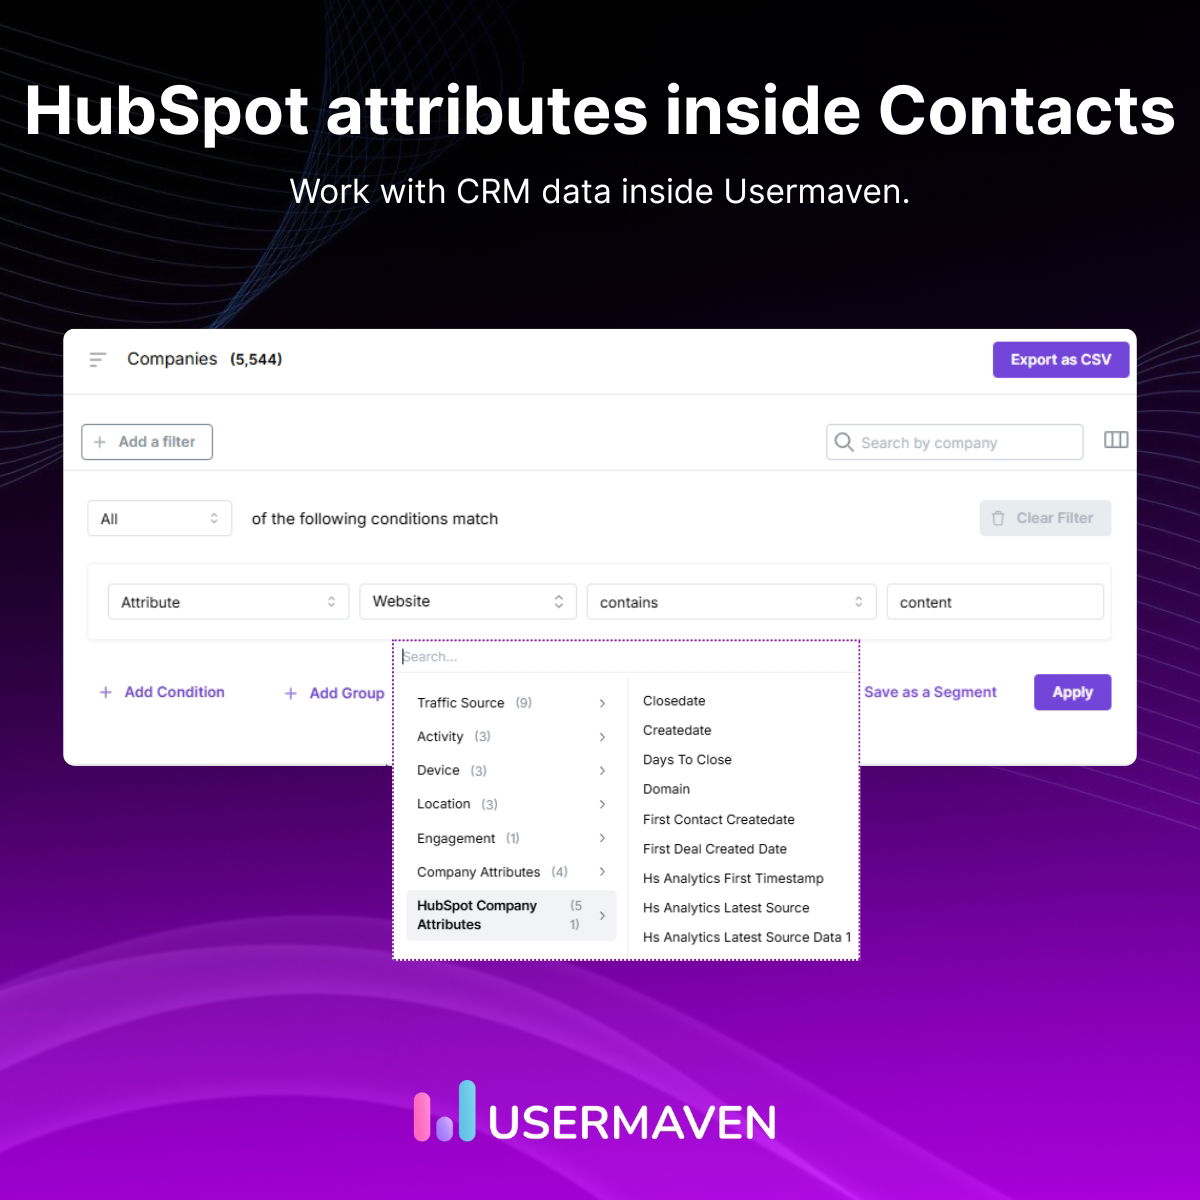
Deeper HubSpot integration in the Contacts Hub
The Contacts Hub now brings richer HubSpot data into your analytics workflow, making it easier to connect CRM data with product insights.
- View HubSpot companies' data directly within the Contacts Hub.
- Use HubSpot attributes when building Segments, with autocomplete for faster filtering.
- Create Conversion Goals from HubSpot events through a redesigned Events workflow.
This update makes it simpler to work with HubSpot data inside Usermaven and build more meaningful segments, goals, and insights across teams.
Event usage auditing with billing-period history
Event usage is now easier to review and understand across billing periods.
- See event usage grouped by billing period directly in Plan & Billing.
- Review total billable events before a billing cycle closes.
- Access event breakdowns to better understand how usage adds up over time.
This update helps teams monitor usage more confidently and avoid surprises.
To learn more about how usage and billing work, click here.
Additional product updates
Alongside the major updates, we’ve shipped several smaller enhancements:
- Added S3 token monitoring and validation, with email alerts for failed or expired checks.
- Expanded Attribution models to show all contact types for complete analysis.
- Improved Event Activity search with support for link-based filtering.
- Introduced infinite scrolling in Events Activity for smoother browsing.
- Updated shared dashboards to respect the creator’s saved default date range.
- Strengthened privacy compliance for cookieless tracking on WordPress sites.
✨ UI and usability improvements
We refined several areas of the interface to improve clarity and consistency.
This includes better layouts, improved table behavior, cleaner report creation flows, and clearer no-data states across key analytics views.
⚙️ Bug fixes and performance improvements
We addressed multiple stability and performance issues across the app.
These fixes improve loading times, data accuracy, billing reliability, and overall responsiveness.
📈 That’s it for this update!
All of the updates in this release are available and ready to use.
More updates will follow soon.