🚀 Usermaven just got better: New command bar and improved Analytics
We've made it easier to explore Usermaven, create analytics, and get insights faster with a set of improvements across the platform.
Introducing a command bar to explore and search across Usermaven instantly. We've also unified the experience for Funnels, Trends, Journeys, and Retention. The new Analytics Hub now surfaces key insights and visuals right on the listing interface. Custom dashboards have been refined to make them more natural to set up, giving you both the overview and the detail without switching context.
Alongside these updates, we've polished the interface, resolved performance issues, and delivered a smoother experience across Usermaven.
🔍 Command bar for faster navigation
Finding the right dashboard, analysis, goal, or setting shouldn't take multiple clicks.
A new command bar sits at the bottom of the screen, ready whenever you need it. Click the command bar or press ⌘ + K on Mac (Ctrl + K on Windows) to open it. Now, you can:
- Search across Usermaven by title of dashboards, analytics, goals and settings.
- Jump directly to dashboards, analytics, goals, and settings.
- Move between any part of the platform without manual navigation.

This keeps your workflow moving, no matter how large your analytics library grows.
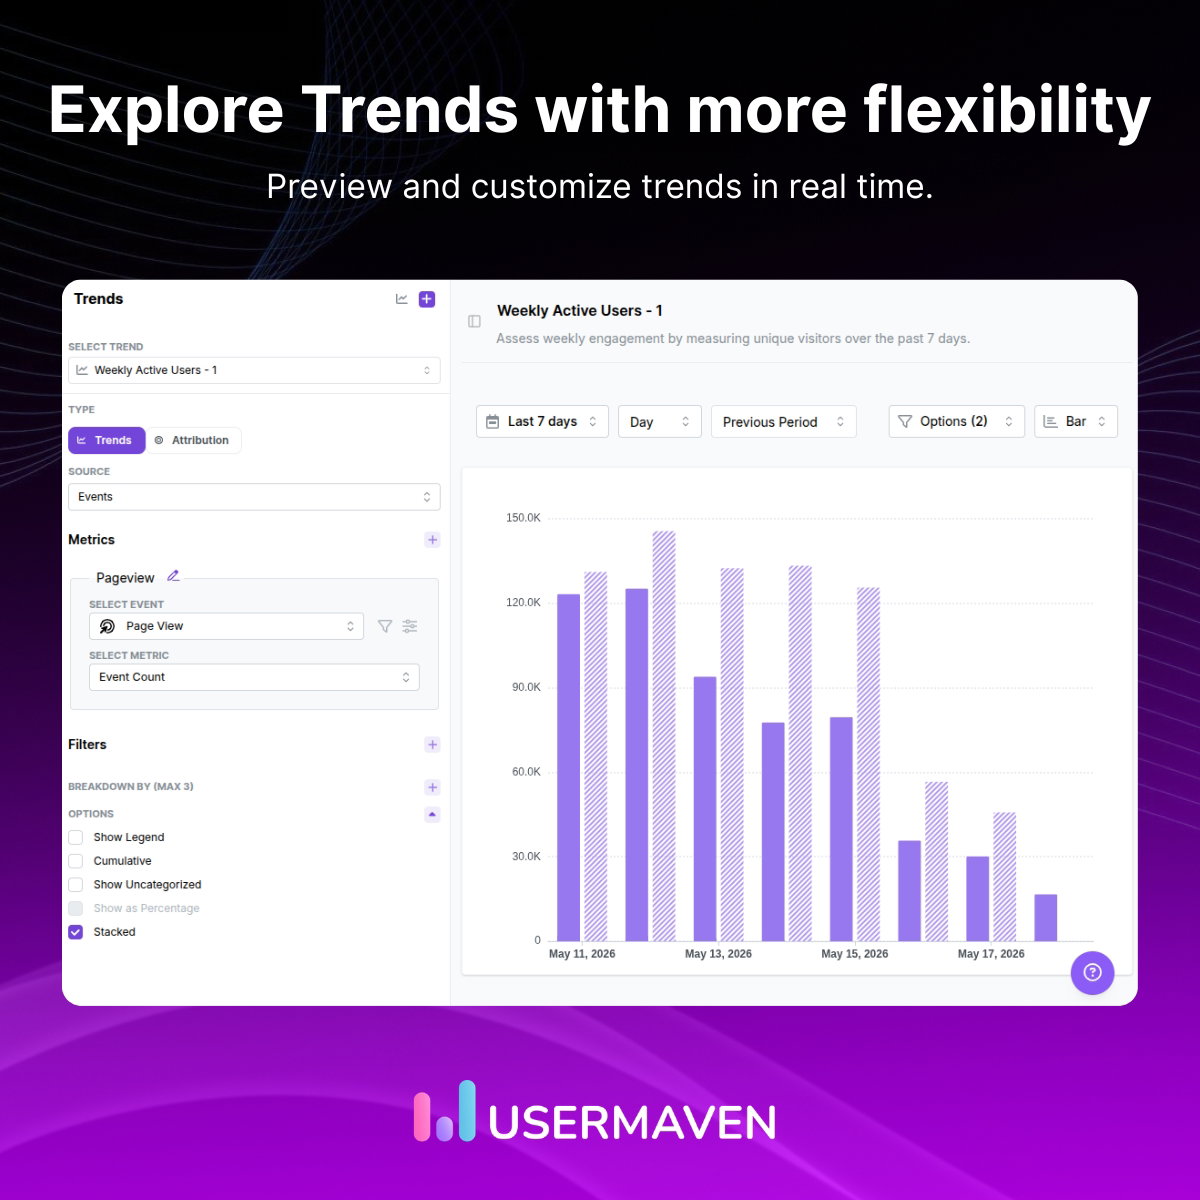
🧩 Unified experience for any analysis type
Building a funnel, trend, journey, or retention analysis used to have different flows in different places. Now, you can:
- Create and configure analysis types from a single, consistent flow.
- Switch between analytics types.
The result is:
- One familiar experience for every kind of analysis you build.
- Faster setup with fewer steps.
- Easier to learn and use across different analytics types.

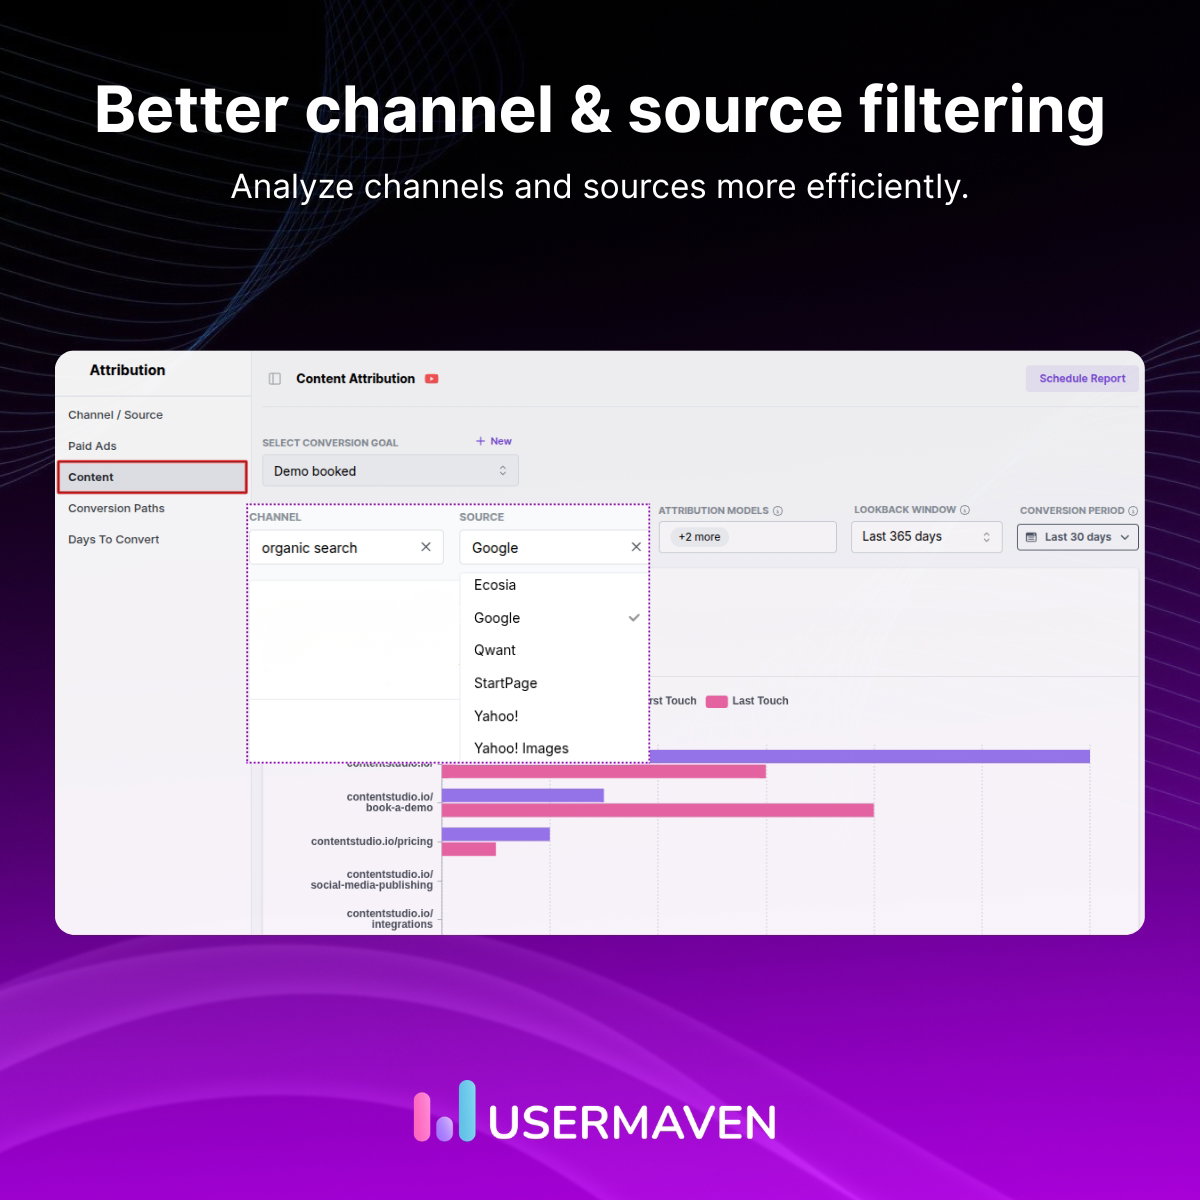
📊 Get more from Analytics at a glance
The analytics listing page has been redesigned to provide richer summaries, key metrics, and visual previews, making it easier to identify the reports you need.
- View key insights and visuals directly on each analysis row.
- Scan your library more quickly and spot what matters before you click.
- Spend less time opening every analysis just to remember what it shows.

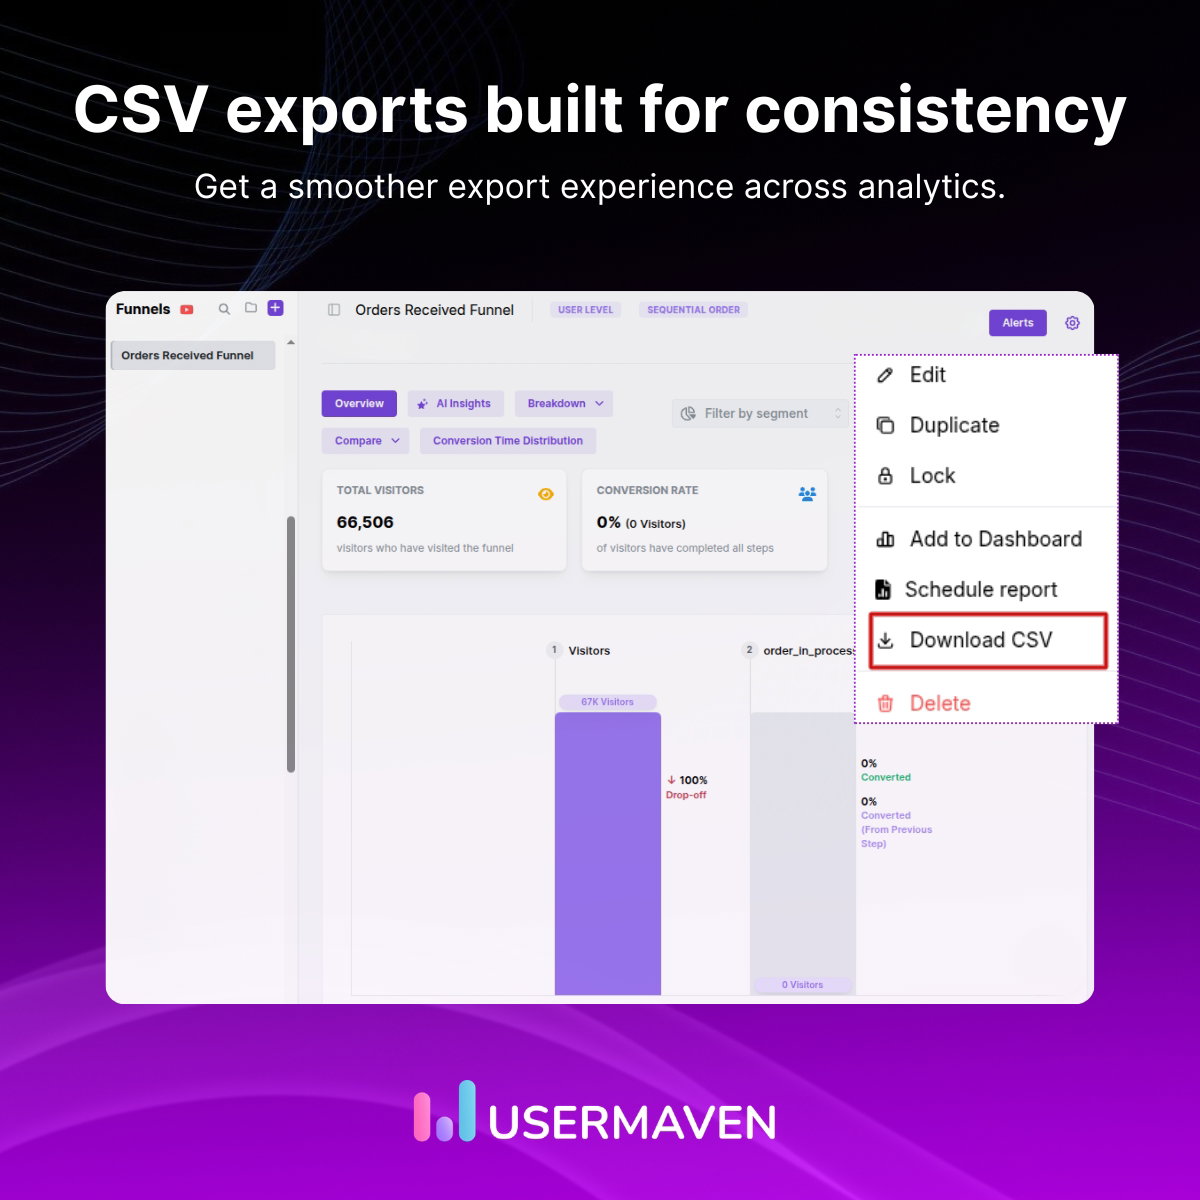
🛠️ Improvements
We've made several usability improvements throughout the analytics experience, including:
- Updated the interface with a modern, consistent design across Usermaven.
- Improved dashboard and analytics layouts.
- Better-organized analytics for easier discovery.
- Refined navigation with improved visual feedback and interactions.
Enjoy a faster, smoother, and more intuitive analytics experience with Usermaven. 🎉
That wraps up this release.
Every improvement in this update is designed to help you navigate Usermaven faster, build analytics more efficiently, and uncover insights with less effort.
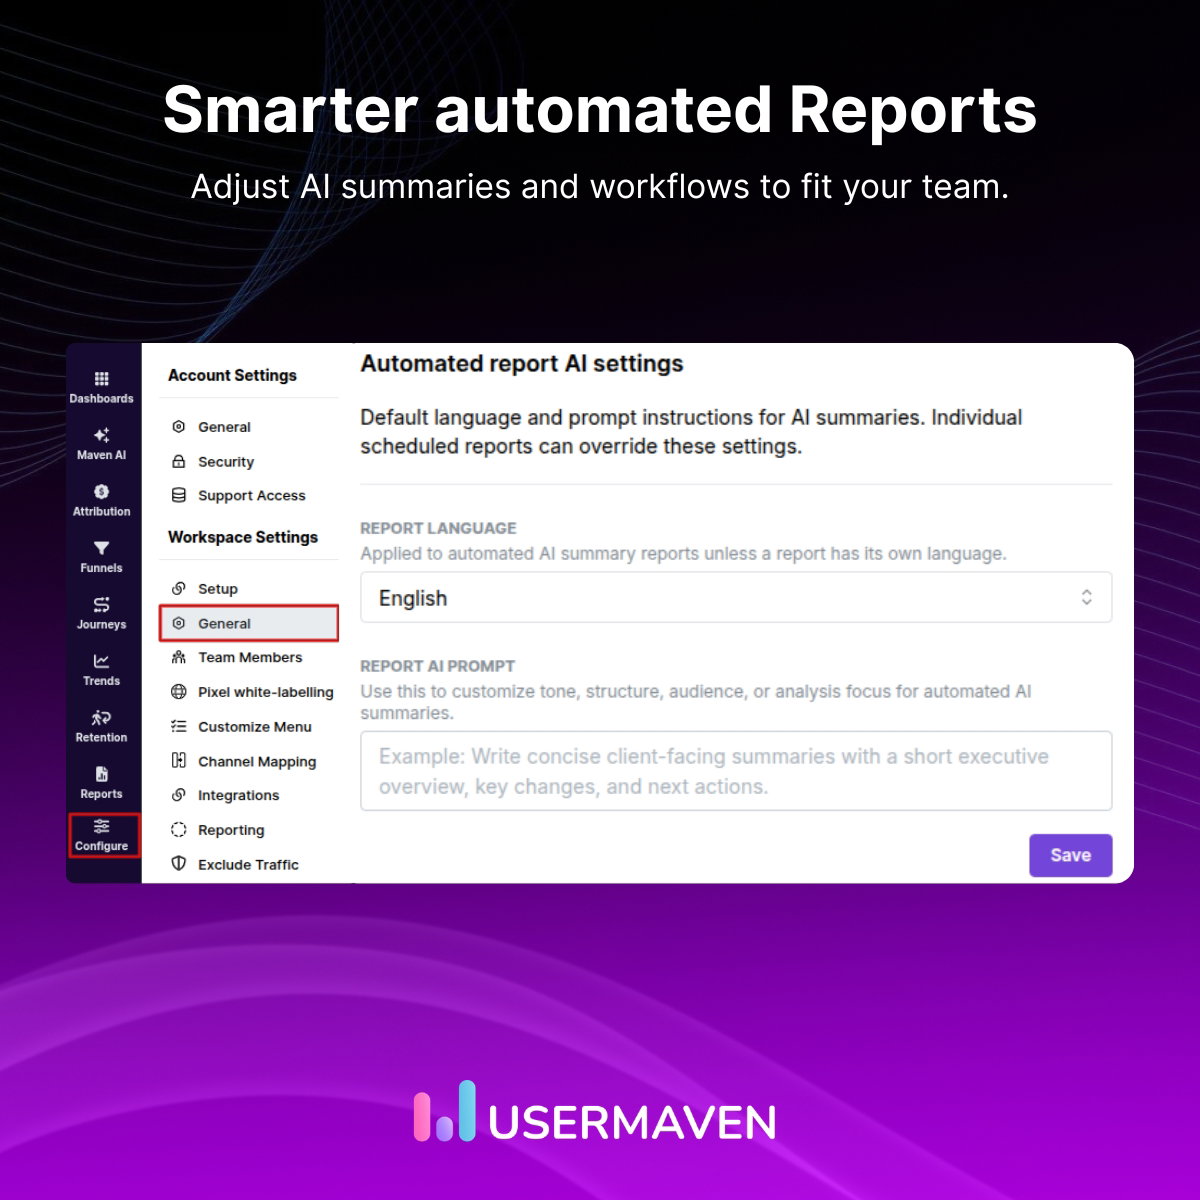
As part of our continuous improvements, upcoming releases will bring more control with Maven AI, expanded integrations with third-party platforms, and better ways to track, analyze, and understand your data to make smarter decisions.
Thank you for being part of the Usermaven community. Your feedback continues to shape what we build next, and we're excited to share more with you in the coming releases.


![Usermaven Changelog [Oct 20, 2025]](https://assets.cdn.frill.co/2959162/5de38c81-f935-4e81-ab3f-b40bcaa5c88c.jpg?width=2400&height=2400)
![Usermaven Changelog [Oct 20, 2025] 1](https://assets.cdn.frill.co/2959162/5fc49522-9627-44ac-b9fe-74dd21a14b95.jpg?width=2400&height=2400)