Company timeline view, analyze traffic change in top sources, UTM metrics, and more
In this week's release, we've introduced two significant new features in Usermaven. Let's delve deeper.
Company Timeline View
The Company Timeline View is particularly useful if you wish to monitor how users within a company engage with the application. For B2B SaaS companies, it's crucial to identify which users are most active. This information can later facilitate obtaining feedback from these specific users or exploring upsell opportunities.
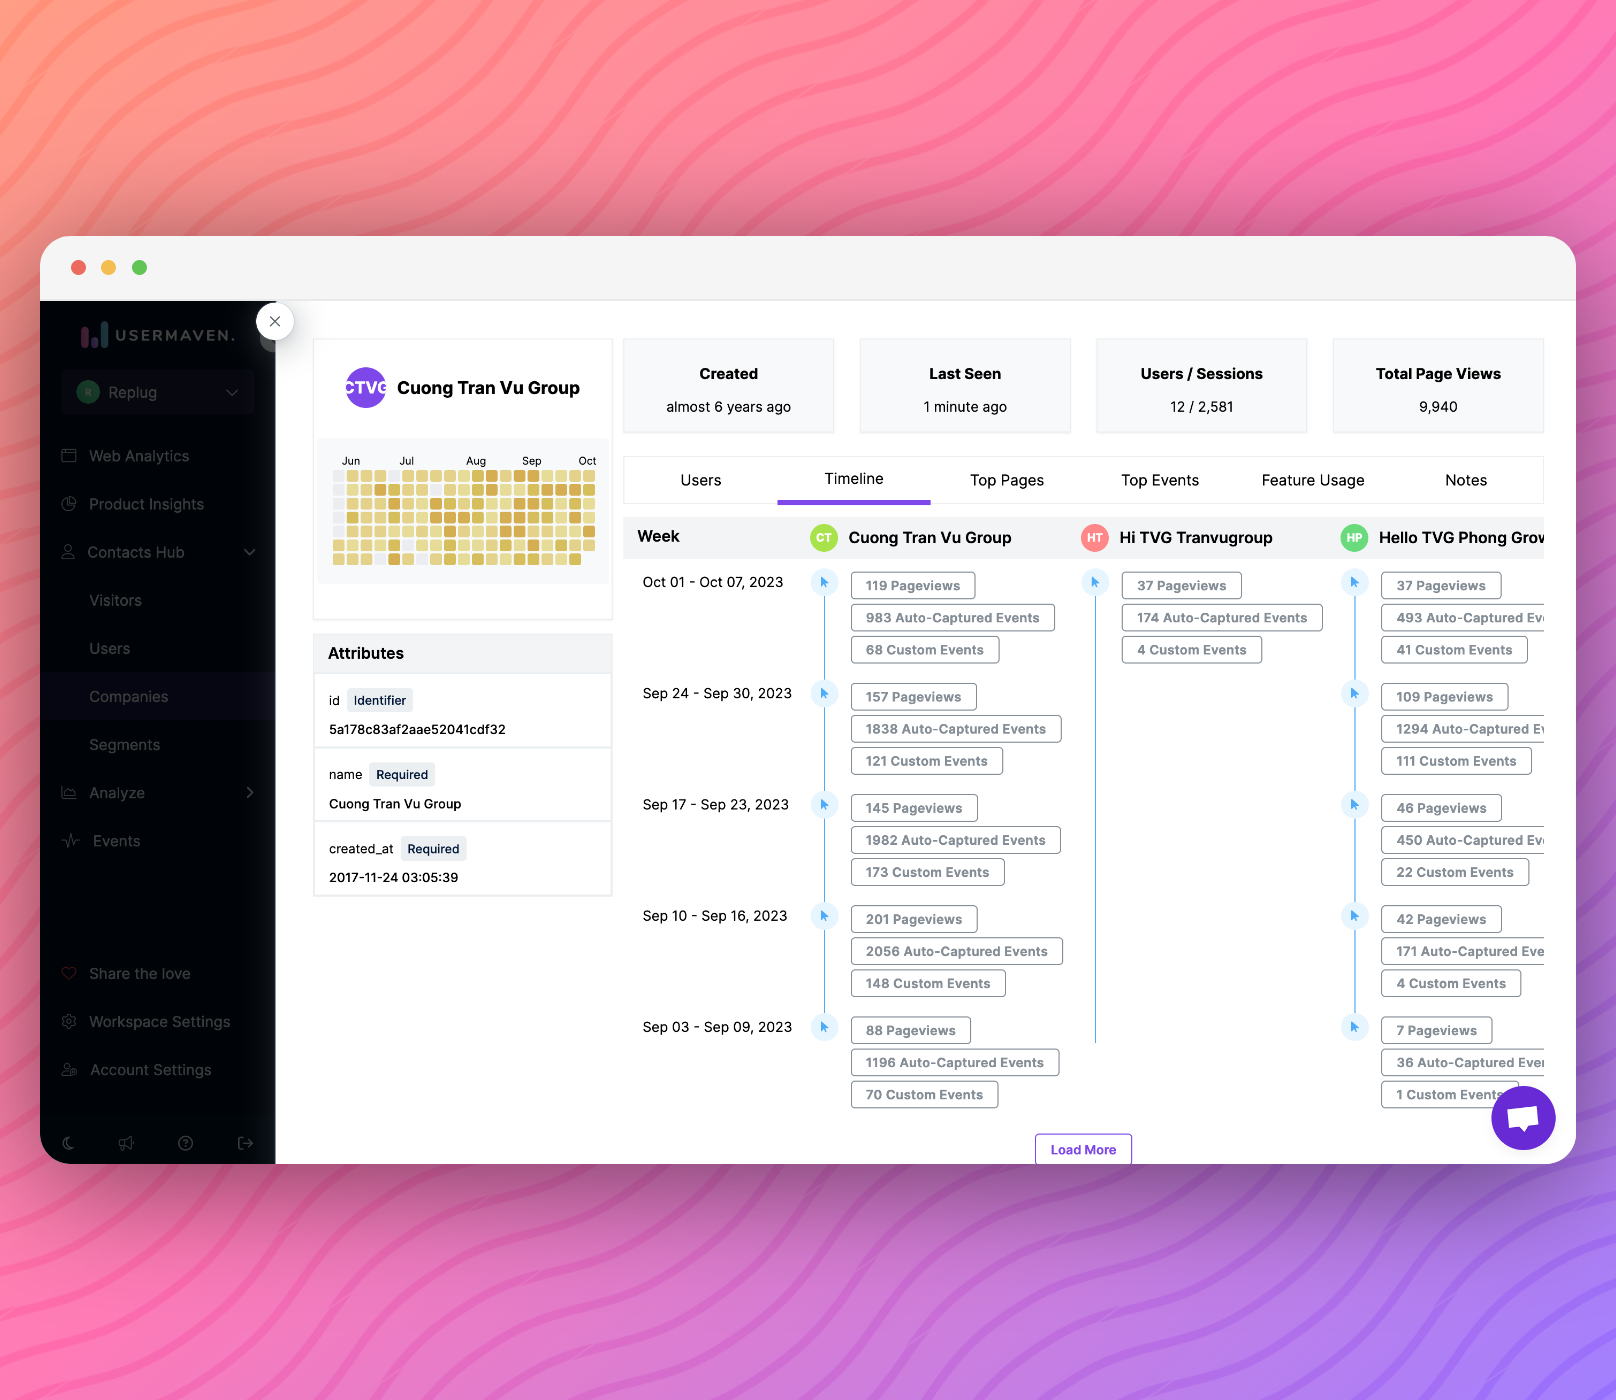
Note: The company timeline view shows the activity based on the weekly basis for the company users.
Should you wish to view the total number of events carried out by users over the past 30 days, you can utilize the 'Users' option within the 'Company' section.
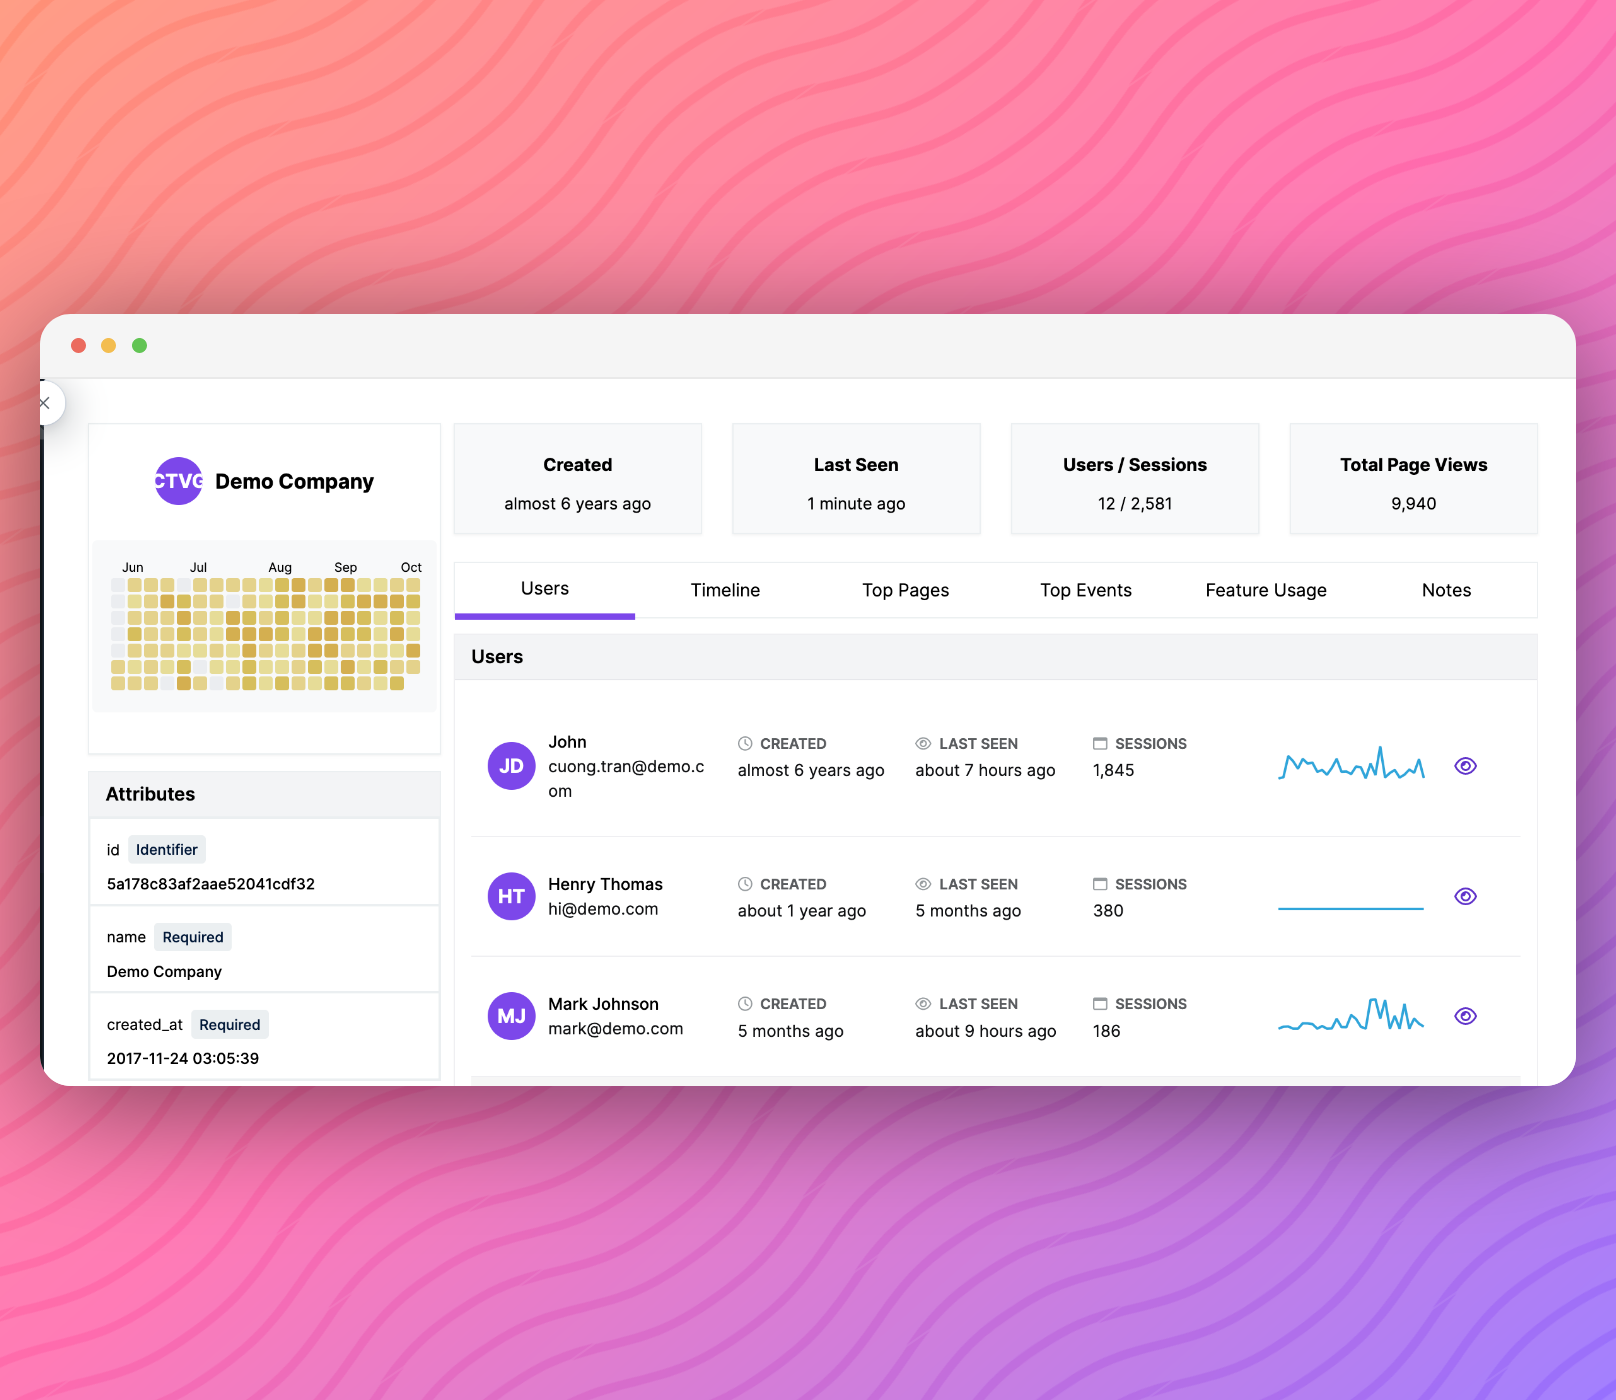
Comparing Traffic Variations: Top sources, UTM traffic and other sections
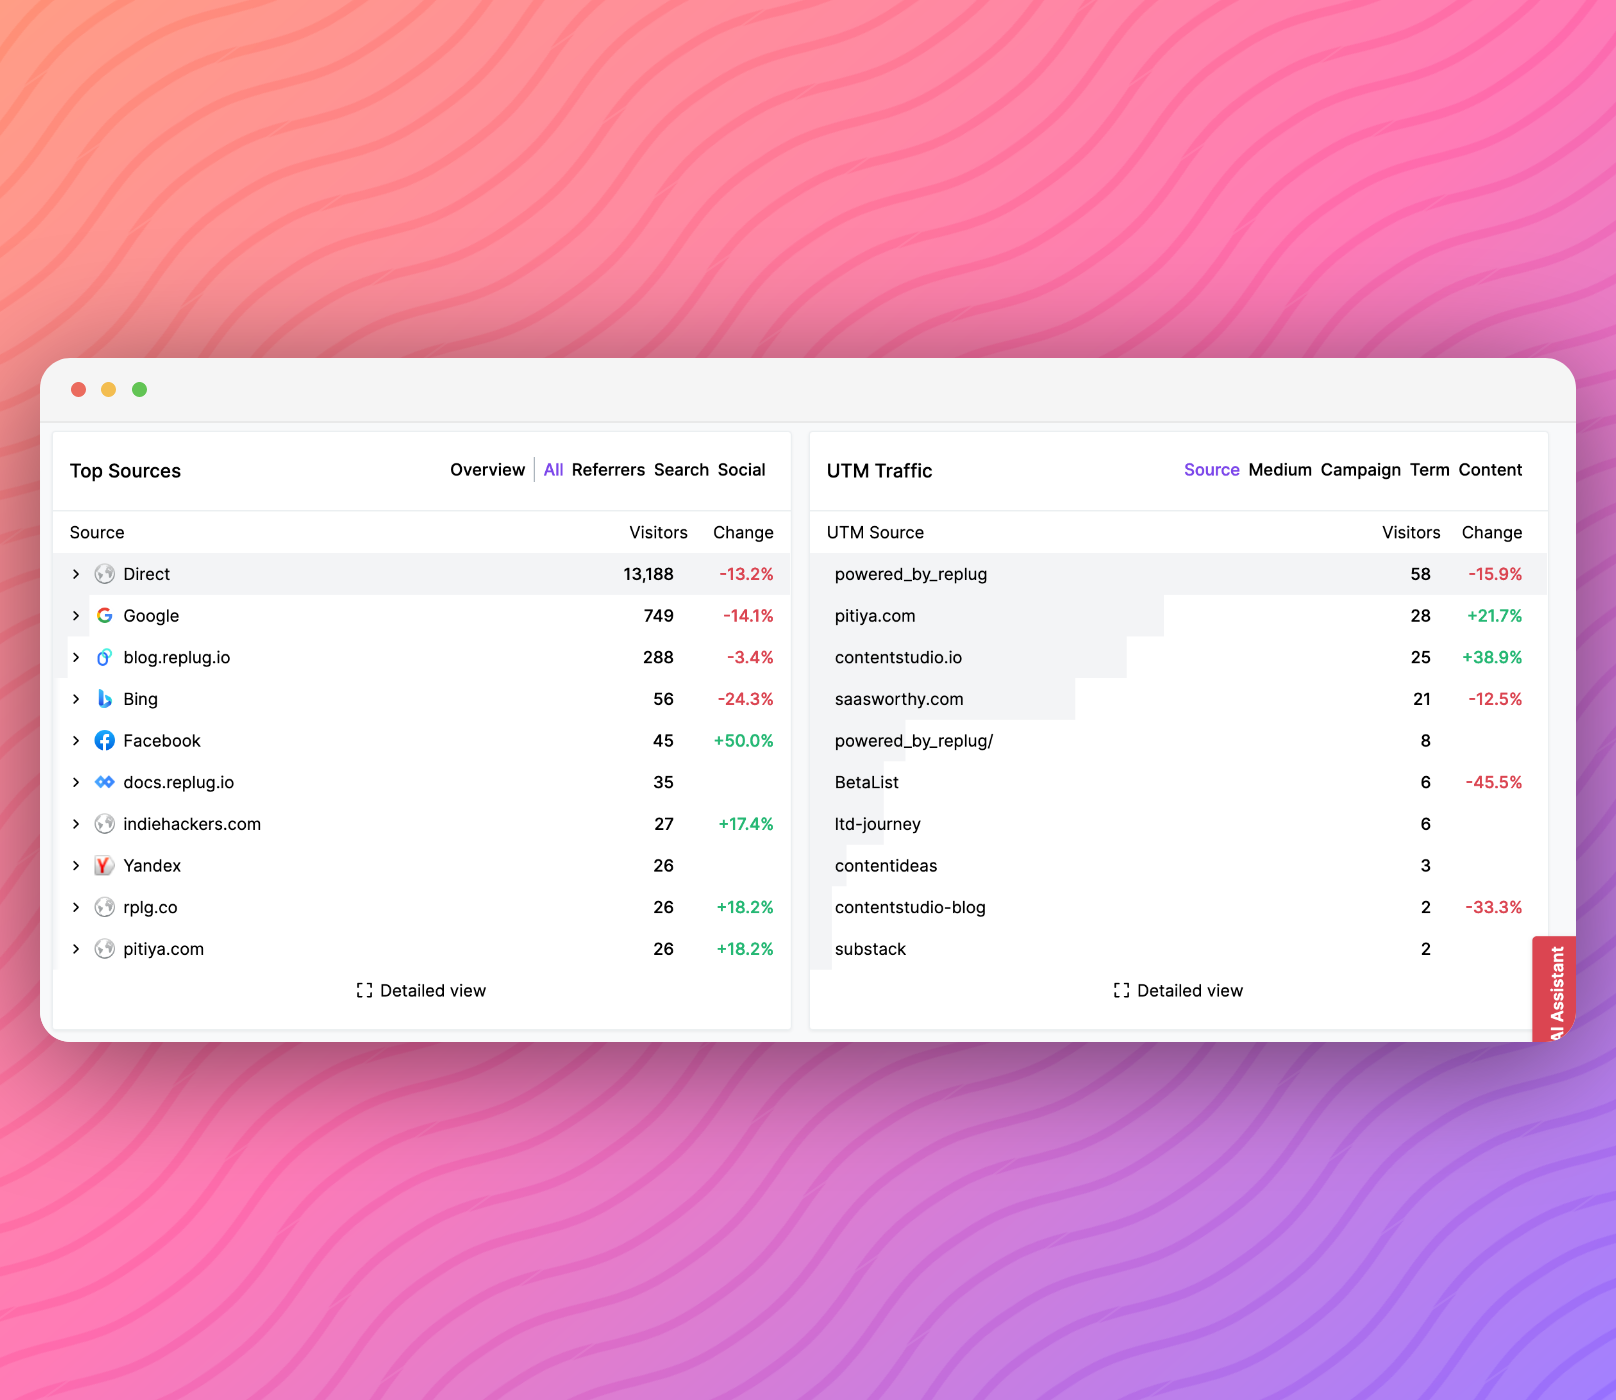
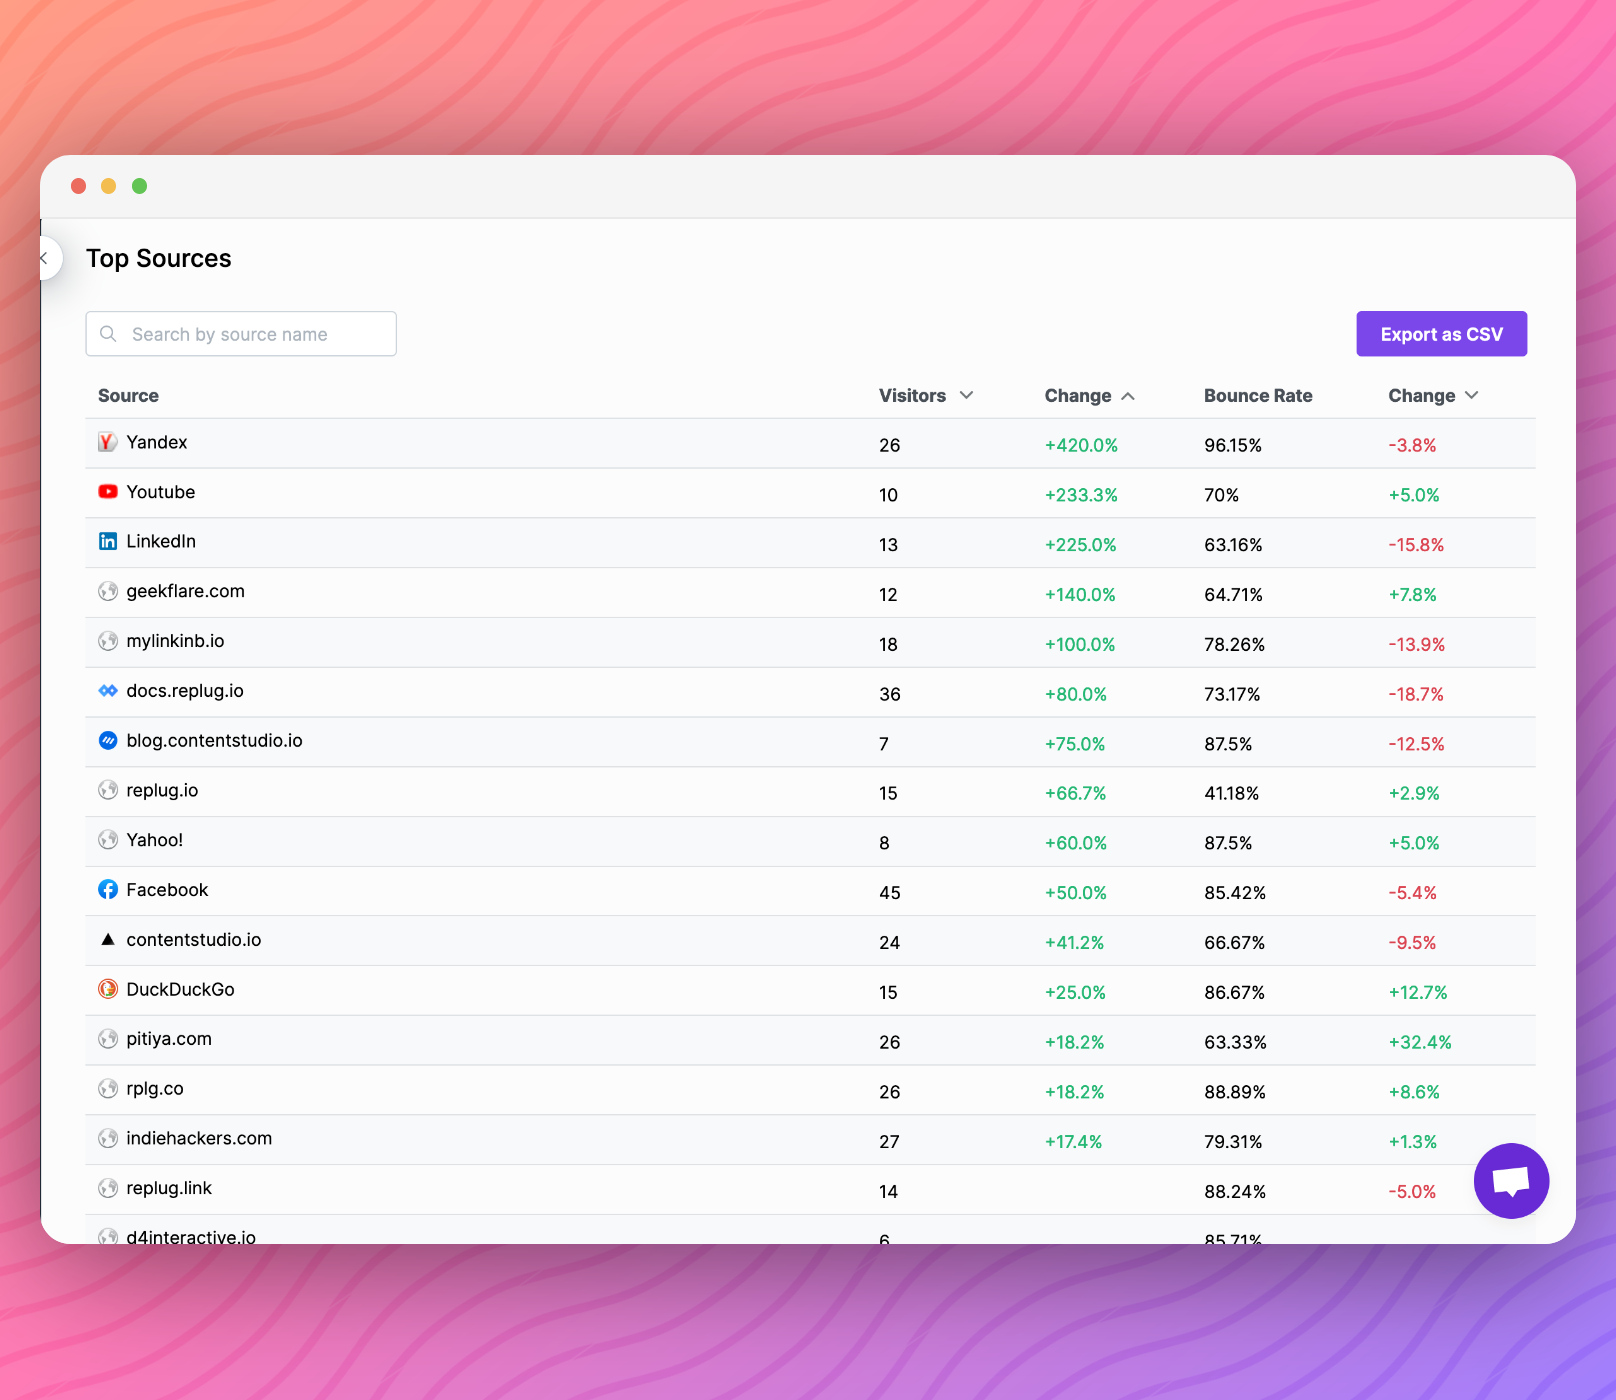
In our latest release, we've further enhanced the analytics comparison feature. Now, when you choose the comparison option, you'll instantly see the percentage change in traffic between the current and previous periods across key sections like Top Sources, UTM Traffic, and more.
This intuitive update empowers you to swiftly pinpoint which traffic sources have experienced increases or decreases, streamlining your analysis and decision-making process.
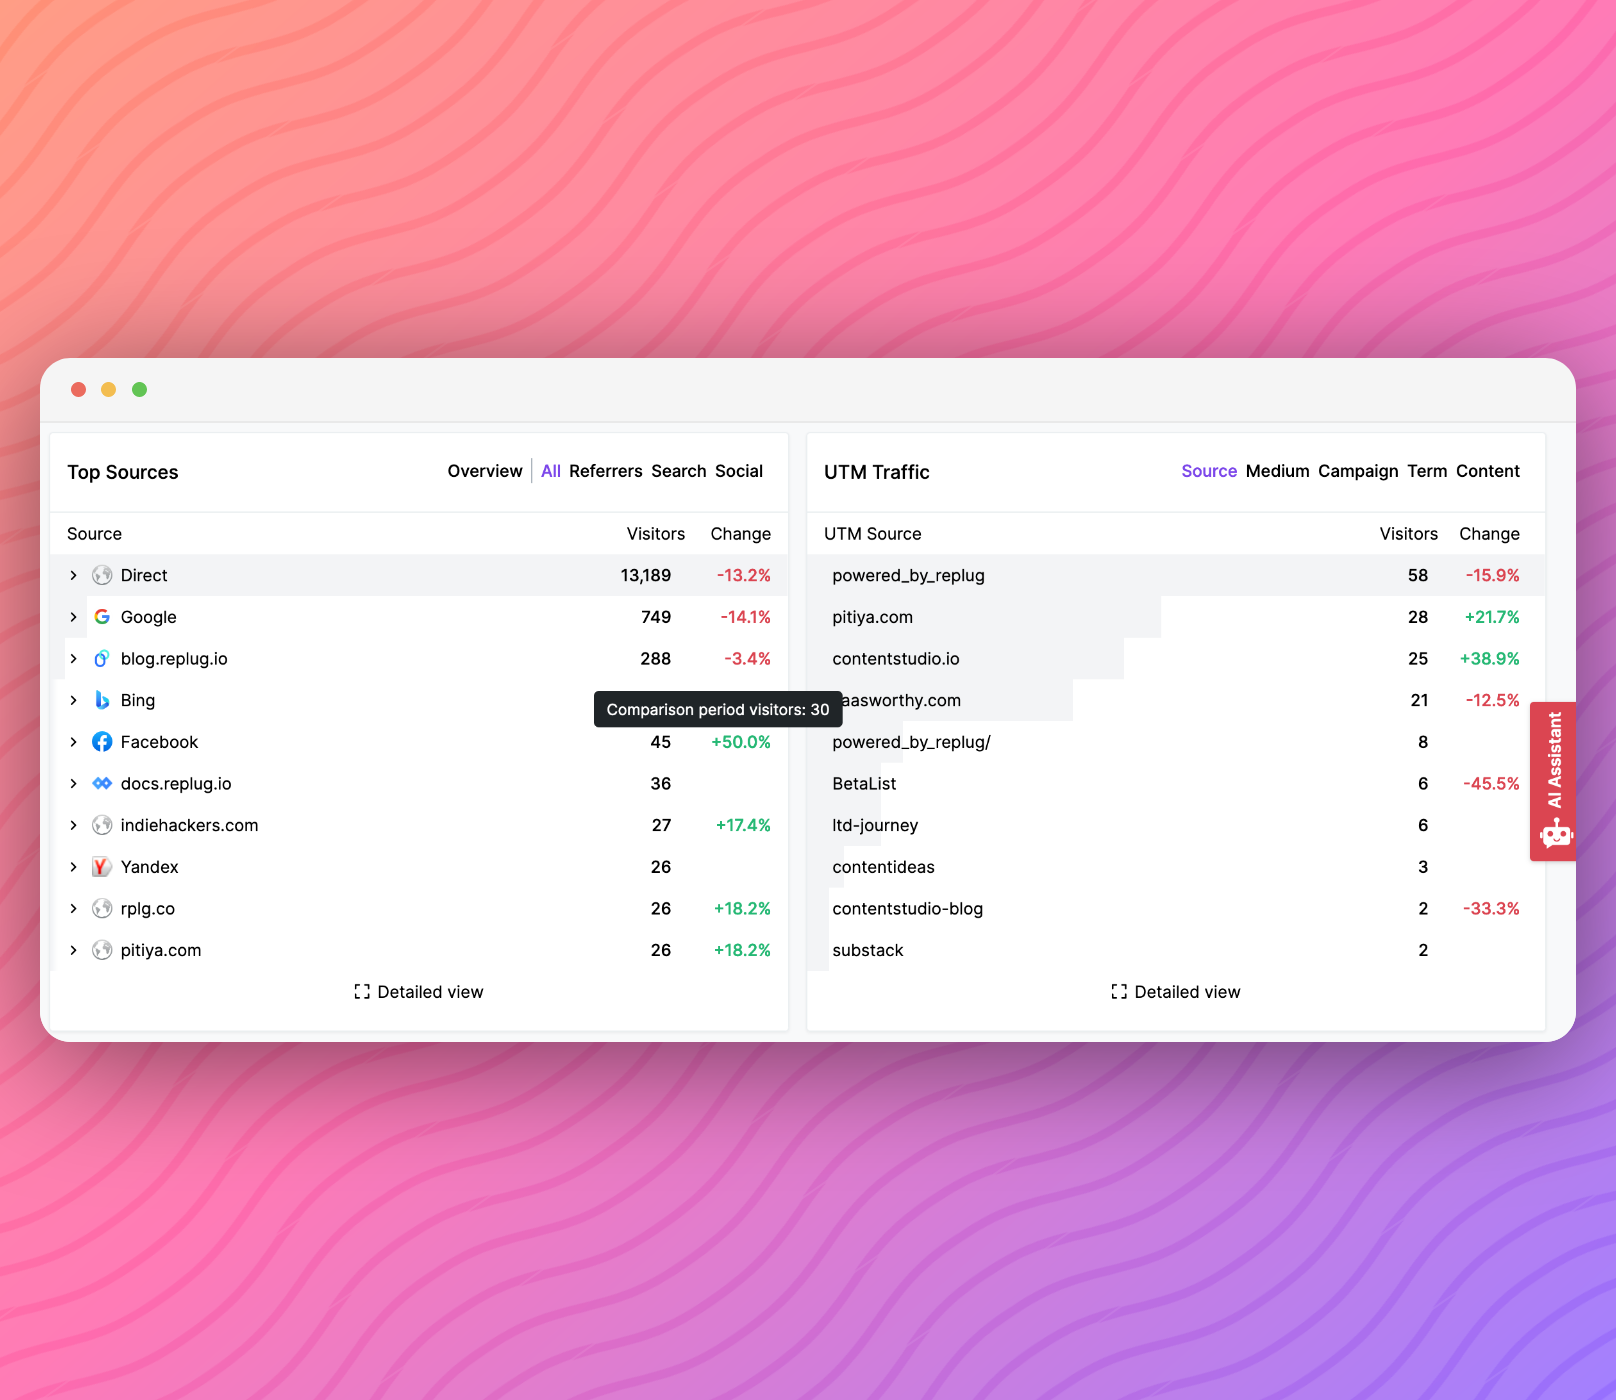
Additionally, hovering over the 'Change' will display the number of visitors from the selected comparison period.
In the detailed view for Top Sources, UTM Traffic, and other sections, the percentage change is now clearly displayed. Additionally, you can easily sort data based on these changes, giving you even more control over your analysis."
We hope you'll find value in these updates. Enjoy!