Feature adoption 2.0, Funnel conversion time distribution, and more..
Usermaven is becoming increasingly powerful, and in today's release notes, we are thrilled to announce a multitude of new features and enhancements that have been made to Usermaven over the past few weeks. So, grab a cup of coffee, and let's explore these updates together.
Feature adoption 2.0
In product insights, we have overhauled the feature adoption metrics, providing you with more meaningful data. Previously, the feature adoption module allowed you to view the percentage of feature usage but did not enable you to define adoption and retention criteria for these features.
With the new Feature Adoption, you now have the option to:
- For large applications with many substantial parts or modules, you now have the option to better organize your features. This includes the ability to create modules and put individual features within these modules.
- Define adoption criteria, such as the number of times an event is performed by a user, to classify a feature as adopted.
- Similarly, you have the option to define retention criteria. This involves specifying how frequently a feature must be used by users — whether weekly, bi-weekly, or monthly — to categorize them as retained users.
- You can generate a group report to obtain a bird's-eye view of how features are being utilized across the platform. Additionally, you have the option to view detailed information on individual features within just a few seconds.
- You can track the frequency of usage by "Adopted" and "Retained" users on your platform, along with data on their first and last usage.
- Last but not least, we've significantly improved the user experience (UX) for the feature adoption module.
Creating a new feature report is very straightforward.
i) Go to the "Manage Features" section from right top corner.
ii) Select the event associated with your feature, which could be a visited page URL, a custom event, or a pinned event.
iii) After that, define the adoption and retention criteria for your feature.
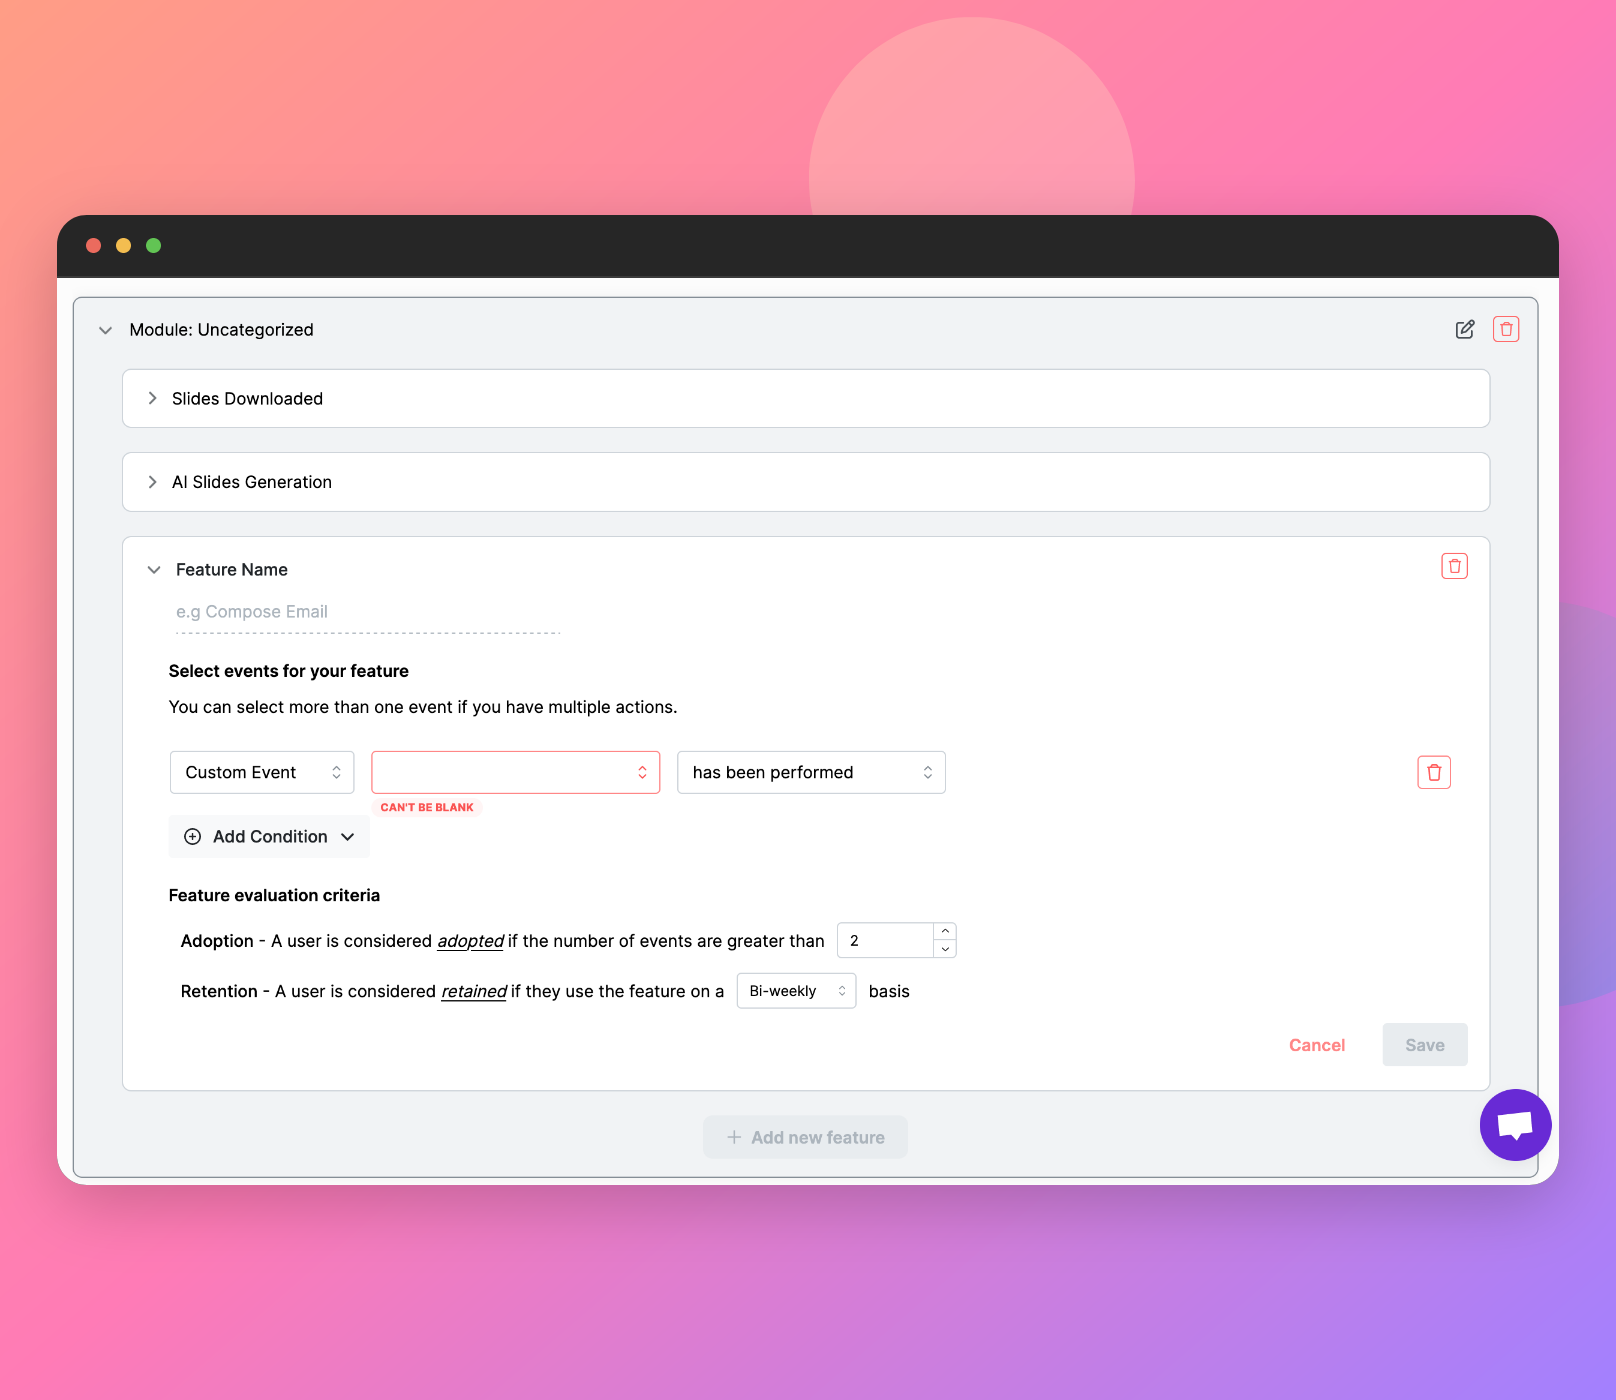
You also have the flexibility to define as many features as you want and organize them into modules for better management and clarity.
Funnel conversion time distribution
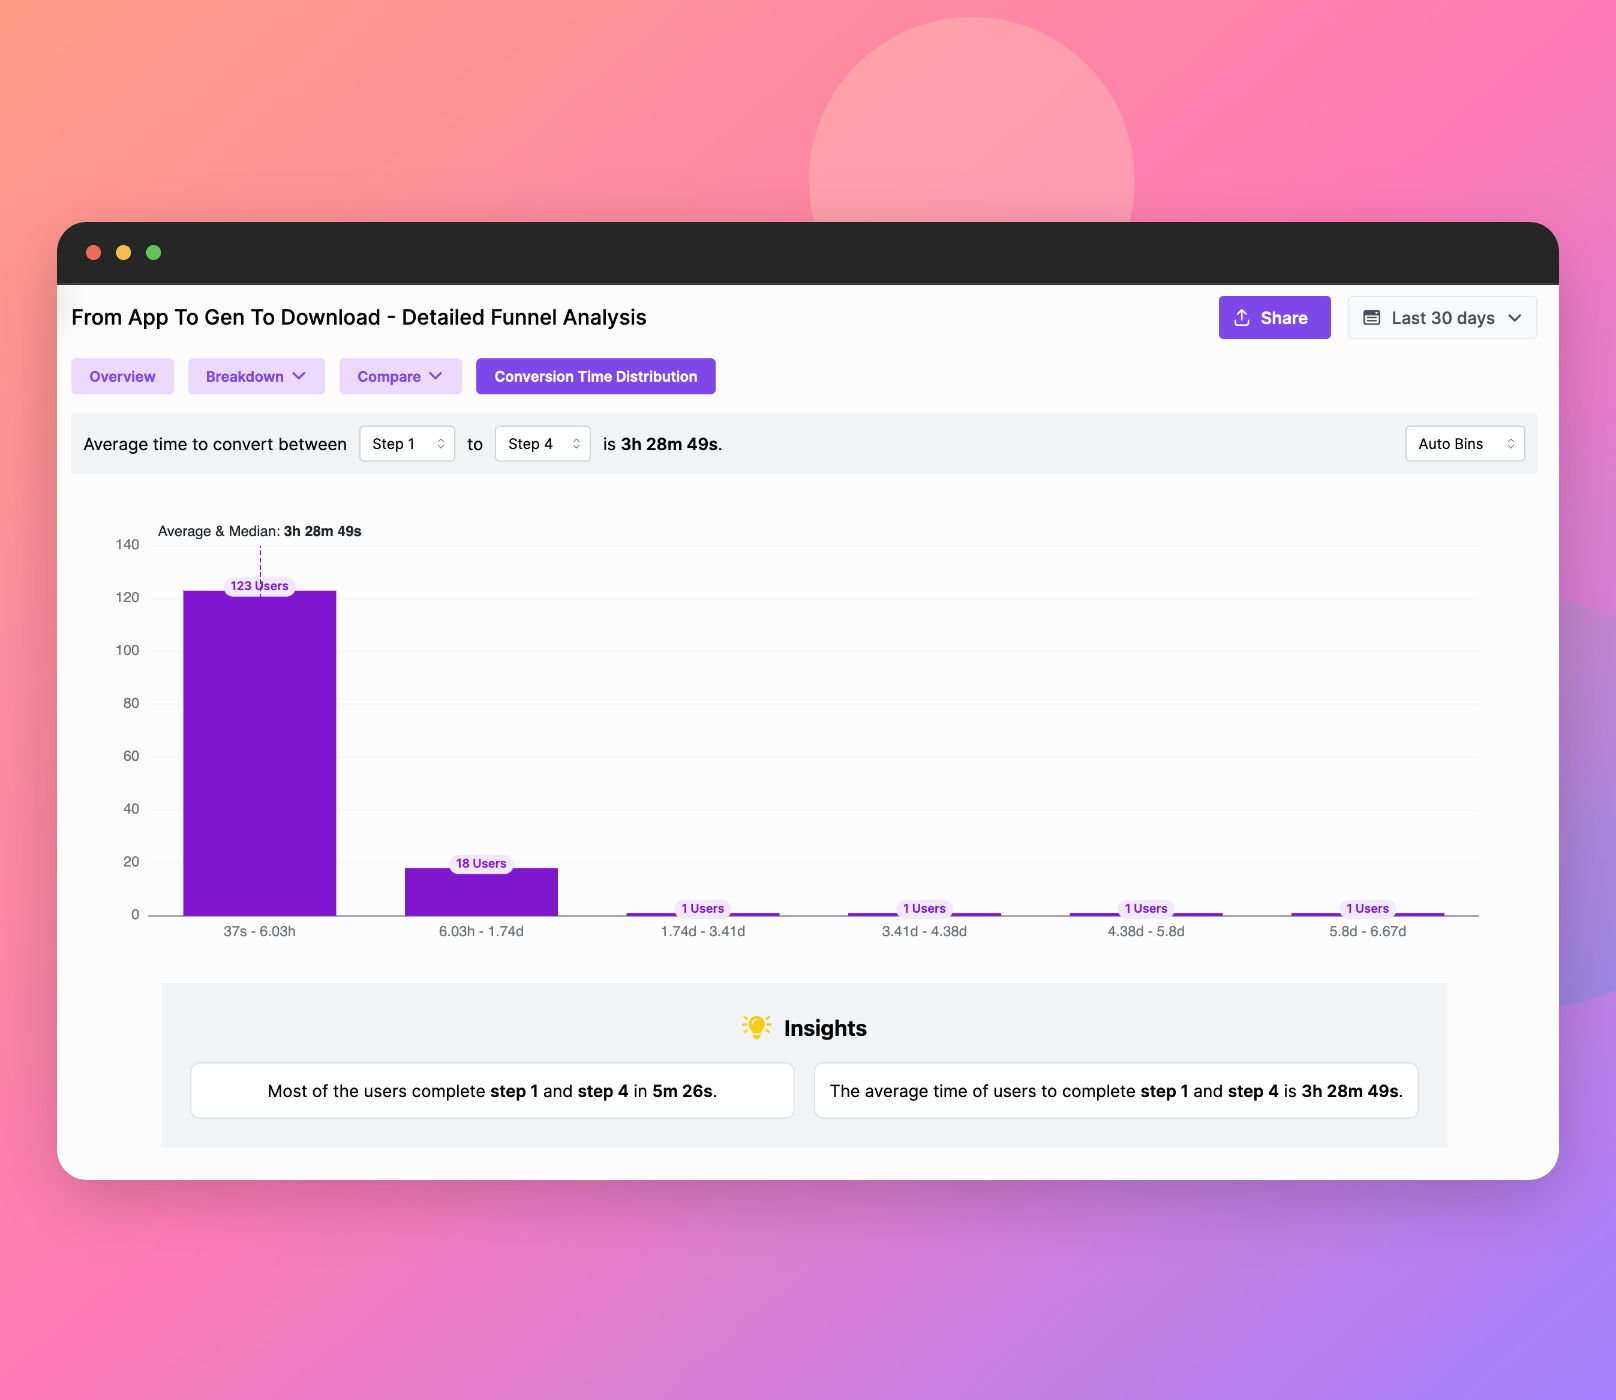
Next, we have introduced a conversion time distribution feature in the detailed funnel analysis. A time histogram serves as a valuable tool for analyzing the average time it takes to complete steps in a funnel or process.
This visual representation showcases the distribution of time taken for each step, or between different steps. Such a tool can offer insights beyond what a simple average might reveal, highlighting nuances in user behavior and process efficiency.
Dynamic conversion value for conversion goals
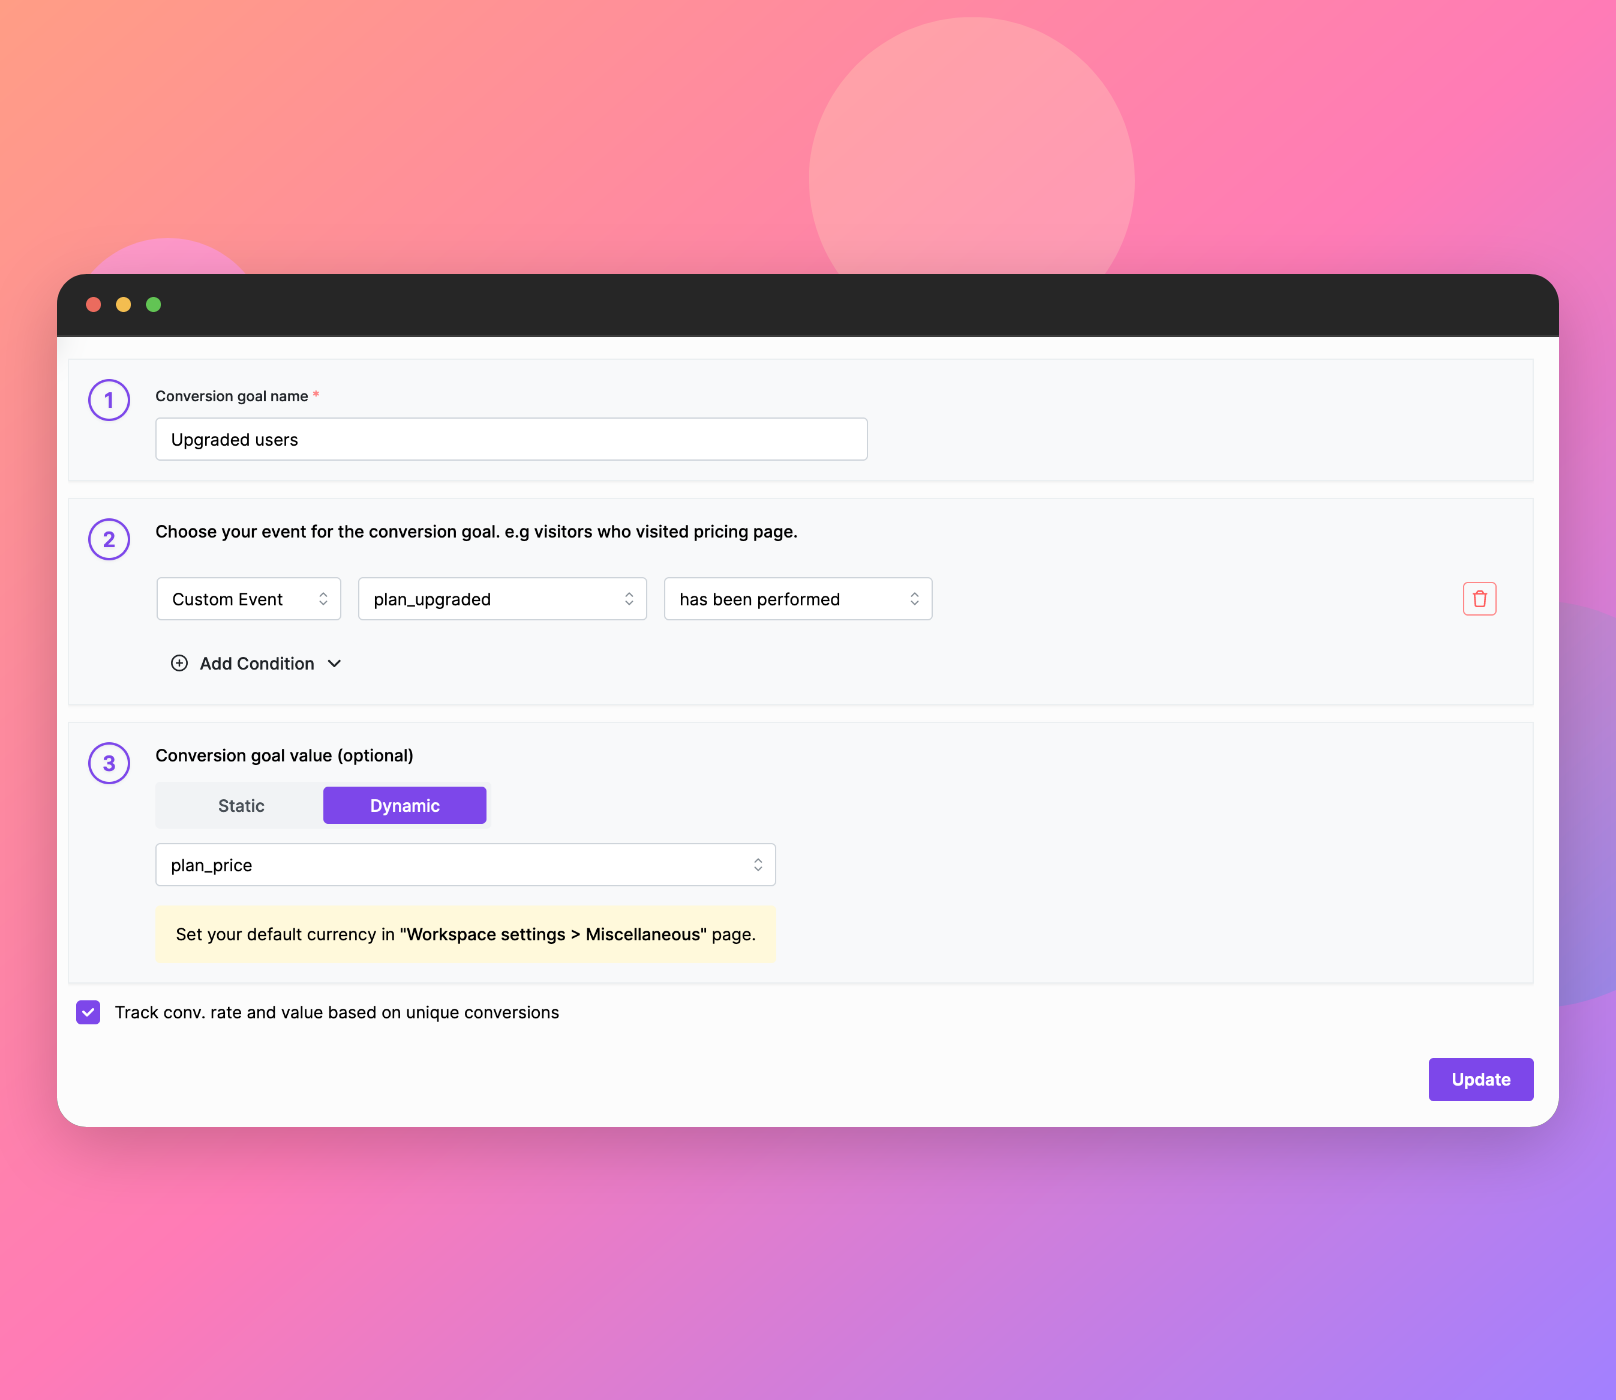
Previously, the option to define the conversion goal value was limited to a static format. However, there are scenarios where dynamic values for conversion goals are more appropriate.
For instance, a SaaS company might be interested in identifying the total number of users who have upgraded, along with their corresponding conversion values.
With this release, you now have the capability to use dynamic values for conversion goals. It's important to note that this feature is available only for custom events, and it requires the passing of attributes. You can learn more about how to pass attributes in custom events from our documentation.
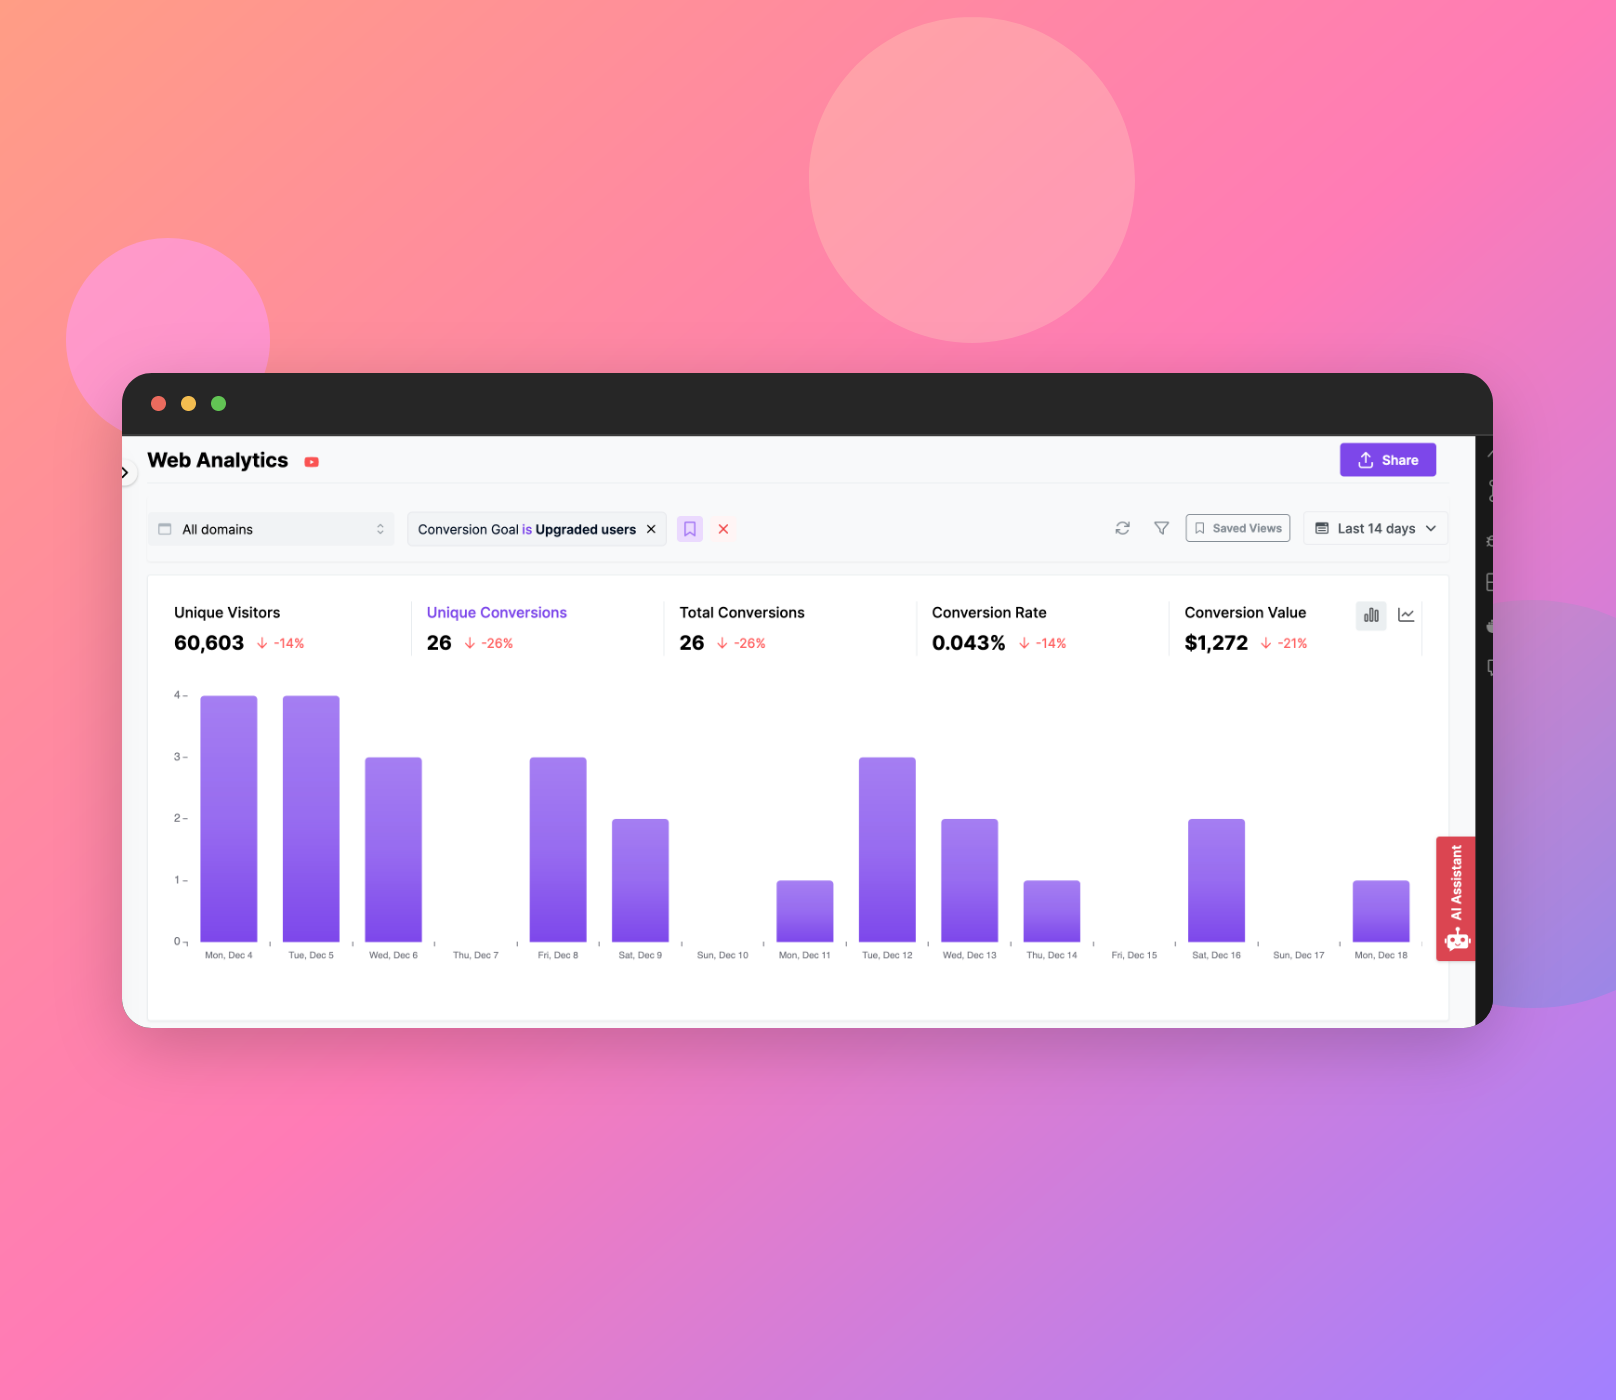
Once you have selected your conversion goal from the Website Analytics, the data will be updated to reflect your choice. The resulting display will be organized to clearly show the relevant information based on your selected conversion goal.
WordPress plugin auto identify logged in Users
Another update has been made to the WordPress plugin.
Track Identified Users
Previously, you had to manually send the Users information to the Usermaven, but now we have provided an option to send logged in Users data to the Usermaven automatically from your WordPress website.

Exclude logged in users visits by roles
In the WordPress plugin, we have added an option to exclude events from being sent to Usermaven based on the roles of the logged-in users. This feature is particularly useful if you are logged into WordPress and visit the website, as it ensures that your own visits are not tracked by the Usermaven pixel.

Auto page-view tracking for Svelte framework
We have introduced support for sending events to Usermaven upon page changes in the Svelte framework. To utilize this feature, you will need to manually add a parameter to the JavaScript script: data-auto-pageview="true". This enhancement simplifies the process of tracking page views and user interactions within applications built using Svelte.
View daily, weekly, and monthly active users list
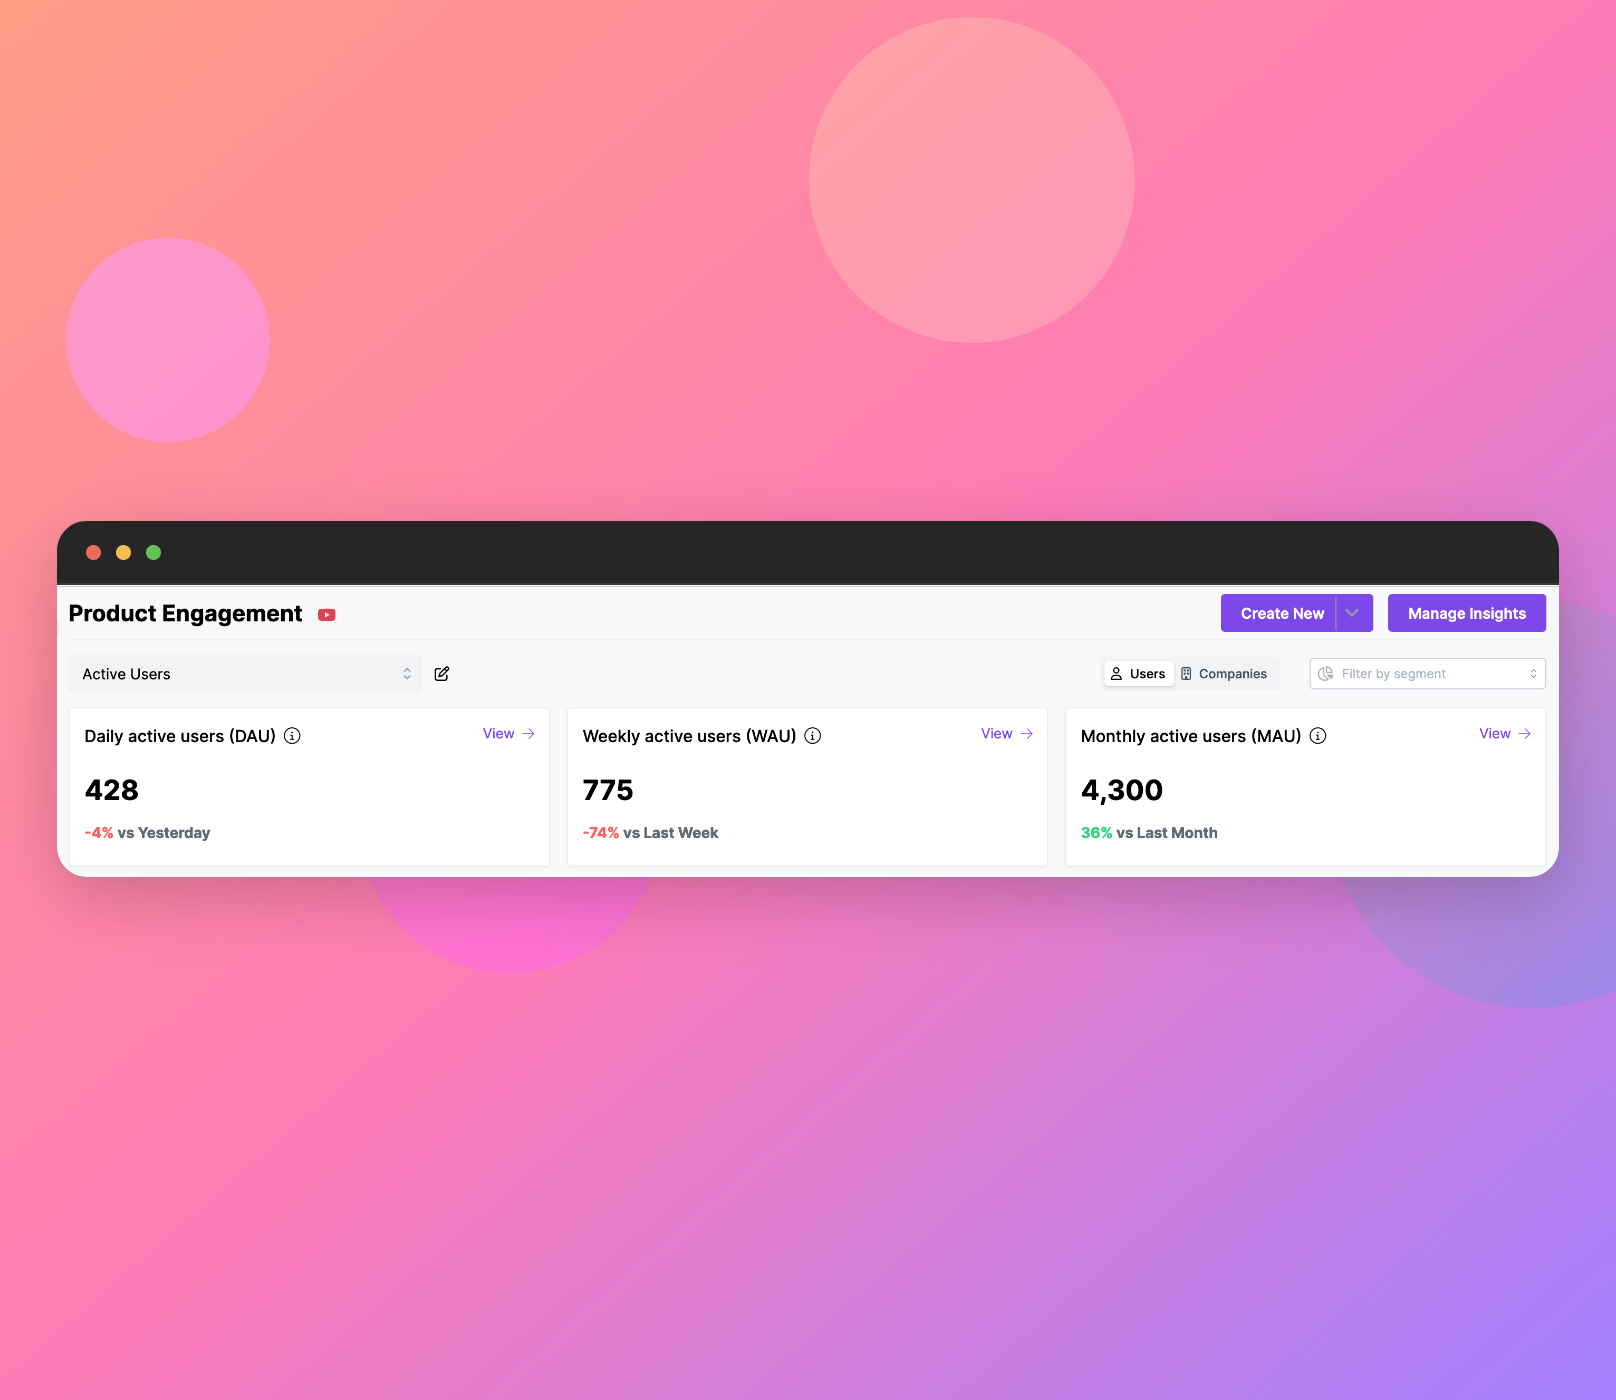
We have introduced a feature in the "Product Engagement > Active Users" insight section that allows you to obtain a list of daily, weekly, and monthly active users. By clicking on the "View" button, you will be able to access and review a detailed list of users who are actively engaging with your product on a daily, weekly, or monthly basis.
SDKs for React and Next
Our official React and Next.js Software Development Kits (SDKs) are now available and are the recommended tools for integrating Usermaven into your websites and web applications. Both SDKs are designed to be compatible with sending events to Usermaven from server-side components, offering a seamless and efficient way to incorporate analytics and user tracking in your React and Next.js projects.
You can use NPM or Yarn package manager to install these SDKs.
Further, we have added an example for the Next App Router which you can find it here.
Better UX experience for date picker
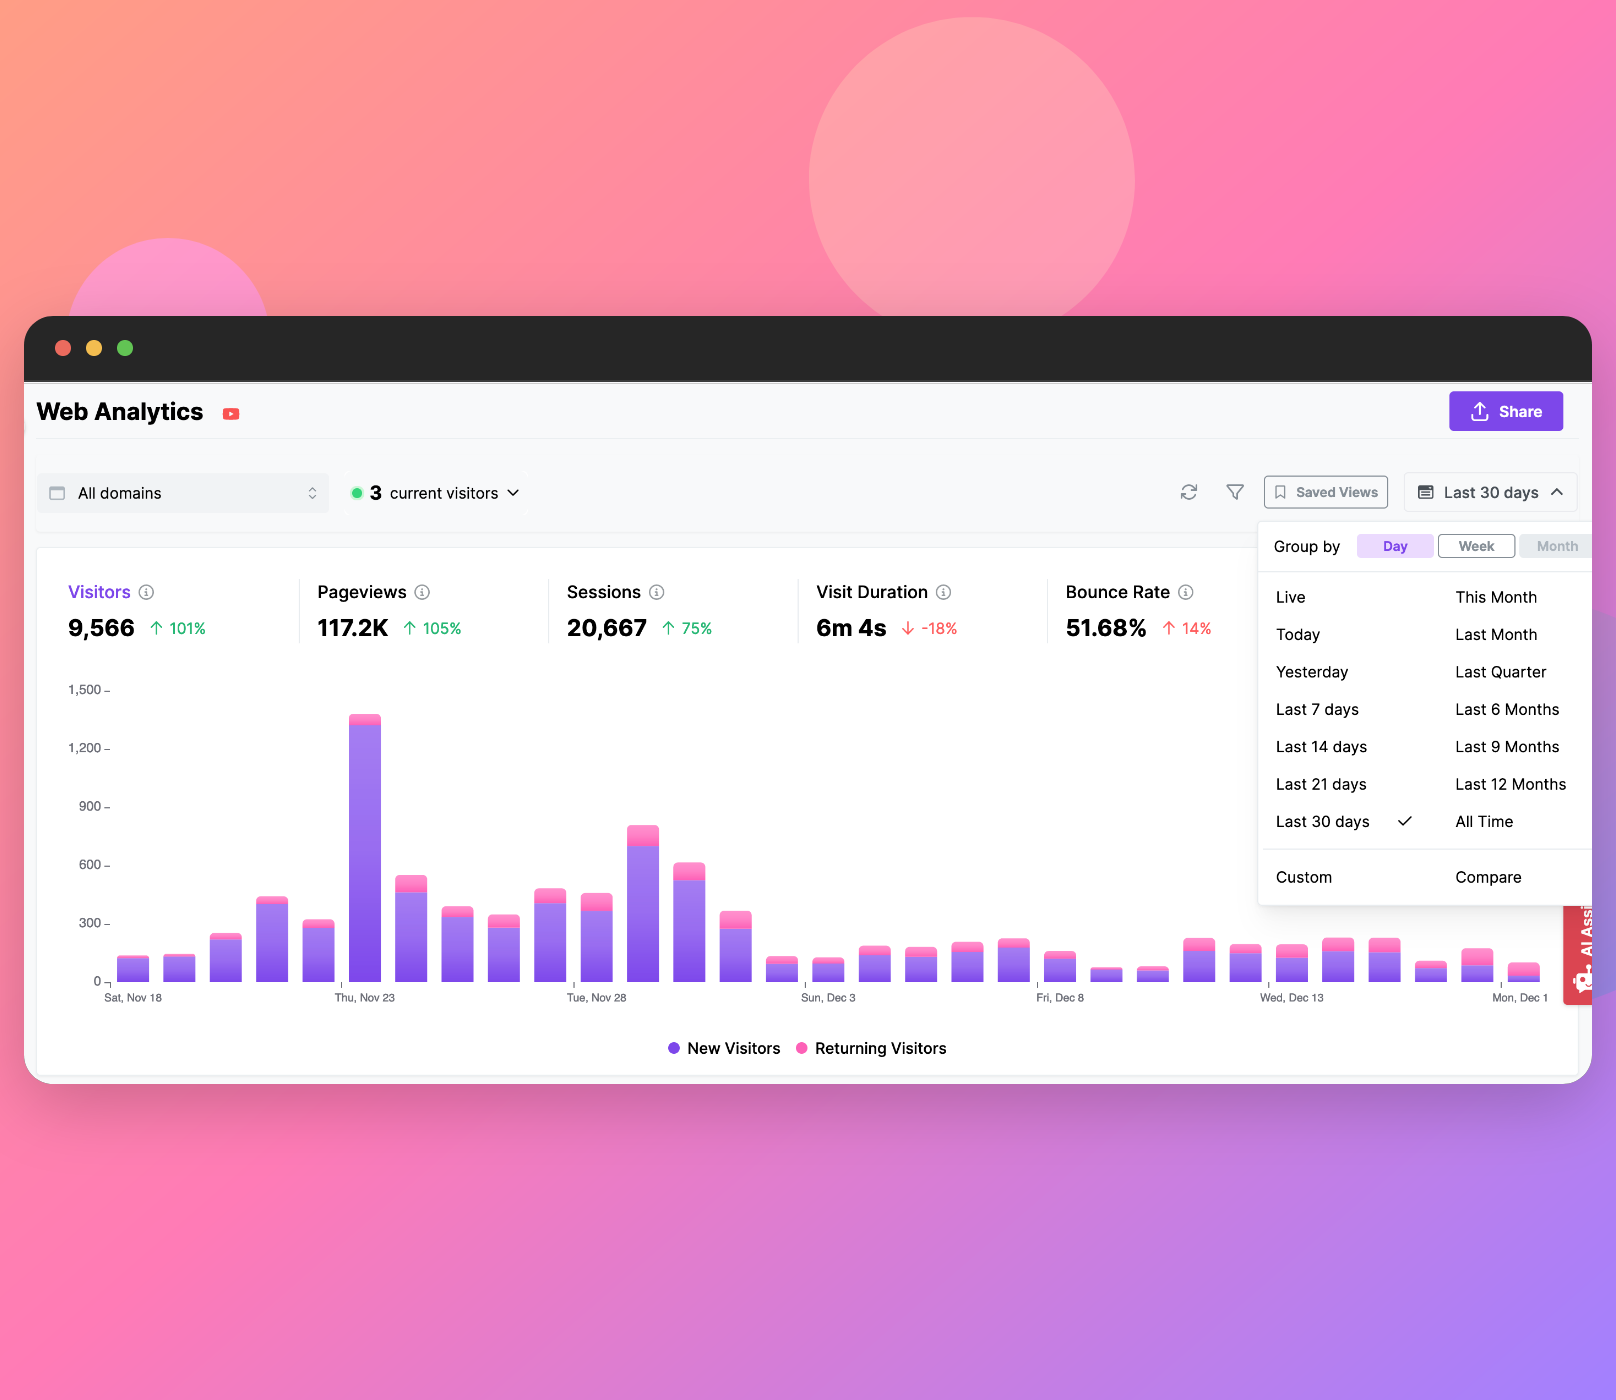
Previously, our date picker featured a single-menu design that displayed a list of dates. We have improved its user experience (UX) by redesigning the menu to be divided into two columns. This enhancement aims to make date selection more intuitive and user-friendly, allowing for easier navigation and a more efficient way to choose dates.
Other Improvements and bug fixes:
- In website analytics, there was an issue where selecting "All Domains" would bring in results from domains that were supposed to be excluded. We have addressed this by implementing a restriction based on the Workspace URL, as well as any additional domains that you have added. This change ensures that the data you see under "All Domains" is more accurate and relevant, excluding any domains that are not part of your intended analytics scope.
- We've resolved corner cases where the report was not listing companies. Now, it should accurately display all relevant company information.
- The issue related to the time on page metric in the "Top Pages" section of website analytics has been fixed. This ensures more accurate tracking and reporting of user engagement on your top pages.
- The interface for setting conversion goals has been shifted from a modal to a side panel. This change is part of our effort to maintain better consistency throughout the platform, offering a more streamlined and user-friendly experience.
- Additionally, we've made various other enhancements across the platform to improve performance, usability, and overall user experience.