Fresh updates: Enhanced user tracking, Journey analysis & platform improvements
We're excited to announce new features and improvements to Usermaven that will help better understand user behavior and streamline the analytics workflow.
Improvements in Trends analysis
We've expanded our Trends feature with new user activity metrics:
- Weekly Active Users (WAU) and Monthly Active Users (MAU) tracking.
- Specialized visualizations for active user analysis.
- Better insights into user engagement patterns.

These new metrics help to better track and understand how users engage with the product over time.
Histogram in Days to Convert
We've added a new histogram visualization to Attribution:
- Track the time it takes for users to convert.
- Analyze conversion patterns over different time periods.
- Gain insights into the conversion timeline.

This visual insight helps understand conversion patterns and optimize user journey timing.
Join Slack integration beta

Our Slack integration is now in private beta. Get Usermaven's web analytics reports delivered directly to your Slack channels, making it easy for teams to receive and discuss data where they already work. Want to try it out?
Fill out our quick access form to join the beta program. [Beta form link].

Journeys analysis updates
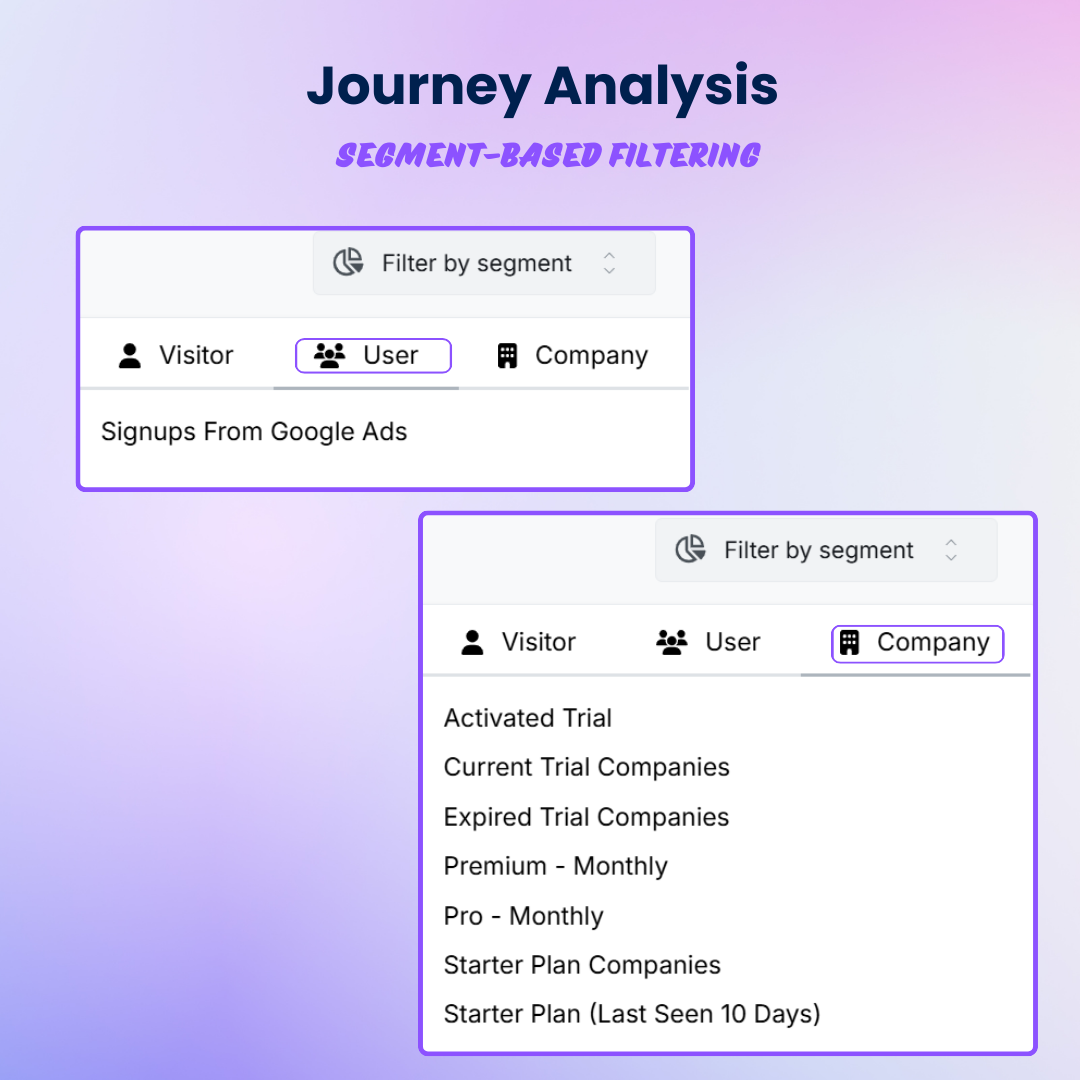
Now, we can filter User Journeys by segments:
- Filter journeys by User, Visitor, or Company level segments.
- Get focused insights into specific user groups.
- Analyze behavior patterns across different segments.

Start segmenting journeys today to discover valuable insights about different user groups.
Conversion rate threshold in Journeys
The conversion rate threshold in Journeys lets you set a minimum conversion rate for nodes to appear individually. Paths below this rate are grouped into "Others" for a cleaner view.

Example:
If the threshold is set to 10%, any paths with conversion rates under 10% (e.g., 3%, 7%) will be combined into "Others." This keeps the focus on higher-impact paths and simplifies analysis.
Platform improvements
From workspace management to data visualization, we've made numerous improvements across the platform to enhance your analytics workflow:
- Added an option to transfer billing when transferring a workspace.
- Conversion goals histogram data is now exportable.
- The "Set as default workspace" option has been added to the Workspaces list view with improved UI.
- Search functionality has been added for pinned events.
- Addressed loading issues for the pinned events histogram.
- Default currency now displays correctly in Attribution reports.
- Enhanced Contacts Hub with company-level feature usage insights.
- Fixed issues with segment attribute selection and date picker styling across the platform.
Each of these updates aims to make your analytics experience smoother and more reliable. We encourage you to explore these improvements and share your feedback with us.